09 April 2020
preps | sorting | filtering | pivot tables
Value Added | daily
Class Schedule
Basics | sessions 01-03
- 09 Jan intro and clients | lecture | labs
- 16 Jan servers and command line | lecture | labs
- 23 Jan networks and protocols | lecture | labs
Web Development | sessions 04-07
- 30 Jan structural layer | lecture | labs
- 06 Feb presentational layer | lecture | labs
- 13 Feb using a structure | lecture | labs
- 20 Feb behavioral layer | lecture | labs
Document Markup | sessions 08-09
Working with Data | sessions 10-13
- 26 Mar formulas, functions, vectors | lecture | labs
- 02 Apr data display | lecture | labs
- 09 Apr manipulate data sets | lecture | labs
- 16 Apr relational data bases | lecture | labs
Presentation | session 14

This work
is licensed under a
Creative Commons Attribution-NonCommercial-ShareAlike 3.0 Unported License.
home & schedule | syllabus | contact | grades
Spreadsheets can be flat file databases.
The tools in Excel can manipulate such databases to array the data exactly as needed.
Using spreadsheets as databases
back to top
According to Microsoft
A PivotTable is an interactive way to quickly summarize large amounts of data. You can use a PivotTable to analyze numerical data in detail, and answer unanticipated questions about your data.
back to top
Pivot Tables
A PivotTable is especially designed for:
- Querying large amounts of data in many user-friendly ways.
- Subtotaling and aggregating numeric data, summarizing data by categories and subcategories, and creating custom calculations and formulas.
- Expanding and collapsing levels of data to focus your results, and drilling down to details from the summary data for areas of interest to you.
- Moving rows to columns or columns to rows (or "pivoting") to see different summaries of the source data.
- Filtering, sorting, grouping, and conditionally formatting the most useful and interesting subset of data enabling you to focus on just the information you want.
- Presenting concise, attractive, and annotated online or printed reports.
But why?
A pivot table is a table of statistics that summarizes the data of a more extensive table (such as from a database, spreadsheet, or business intelligence program). This summary might include sums, averages, or other statistics, which the pivot table groups together in a meaningful way.
Pivot tables are a technique in data processing. They enable a person to arrange and rearrange (or "pivot") statistics in order to draw attention to useful information.
back to top
It begins with deciding what to display.

- Select the cells you want to create a PivotTable from.
Your data shouldn't have any empty rows or columns. It must have only a single-row heading.
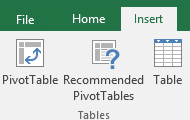
- From the ribbon, insert the pivot table.
- Under Choose the data that you want to analyze select Select a table or range.
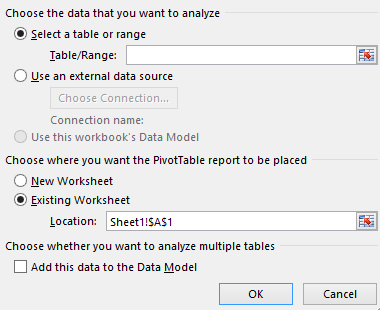
- In Table/Range, verify the cell range.
- Under Choose where you want the PivotTable report to be placed, select New worksheet to place the PivotTable in a new worksheet or Existing worksheet and then select the location you want the PivotTable to appear.
back to top
09 April lecture | preps | sorting | filtering | pivot tables