09 April 2020
preps | sorting | filtering | pivot tables
Class Schedule
- 09 Jan intro and clients | lecture | labs
- 16 Jan servers and command line | lecture | labs
- 23 Jan networks and protocols | lecture | labs
- 30 Jan structural layer | lecture | labs
- 06 Feb presentational layer | lecture | labs
- 13 Feb using a structure | lecture | labs
- 20 Feb behavioral layer | lecture | labs
- 26 Mar formulas, functions, vectors | lecture | labs
- 02 Apr data display | lecture | labs
- 09 Apr manipulate data sets | lecture | labs
- 16 Apr relational data bases | lecture | labs

This work
is licensed under a
Creative Commons Attribution-NonCommercial-ShareAlike 3.0 Unported License.
home & schedule | syllabus | contact | grades
Spreadsheets can be flat file databases.
The tools in Excel can manipulate such databases to array the data exactly as needed.
Using spreadsheets as databases
back to top
According to Microsoft
Use filters to temporarily hide some of the data in a table, so you can focus on the data you want to see.
back to top
Filtering
Filtered data displays only the rows that meet criteria (or "Conditions you specify to limit which records are included in the result set of a query or filter") that you specify and hides rows that you do not want displayed. After you filter data, you can copy, find, edit, format, chart, and print the subset of filtered data without rearranging or moving it.
You can also filter by more than one column.
Filters are additive, which means that each additional filter is based on the current filter and further reduces the subset of data.
Use to filter through only those records of a database that meet specific criteria, such as asking the tool to retrieve only those records that begin with the letter "S". (use this example).
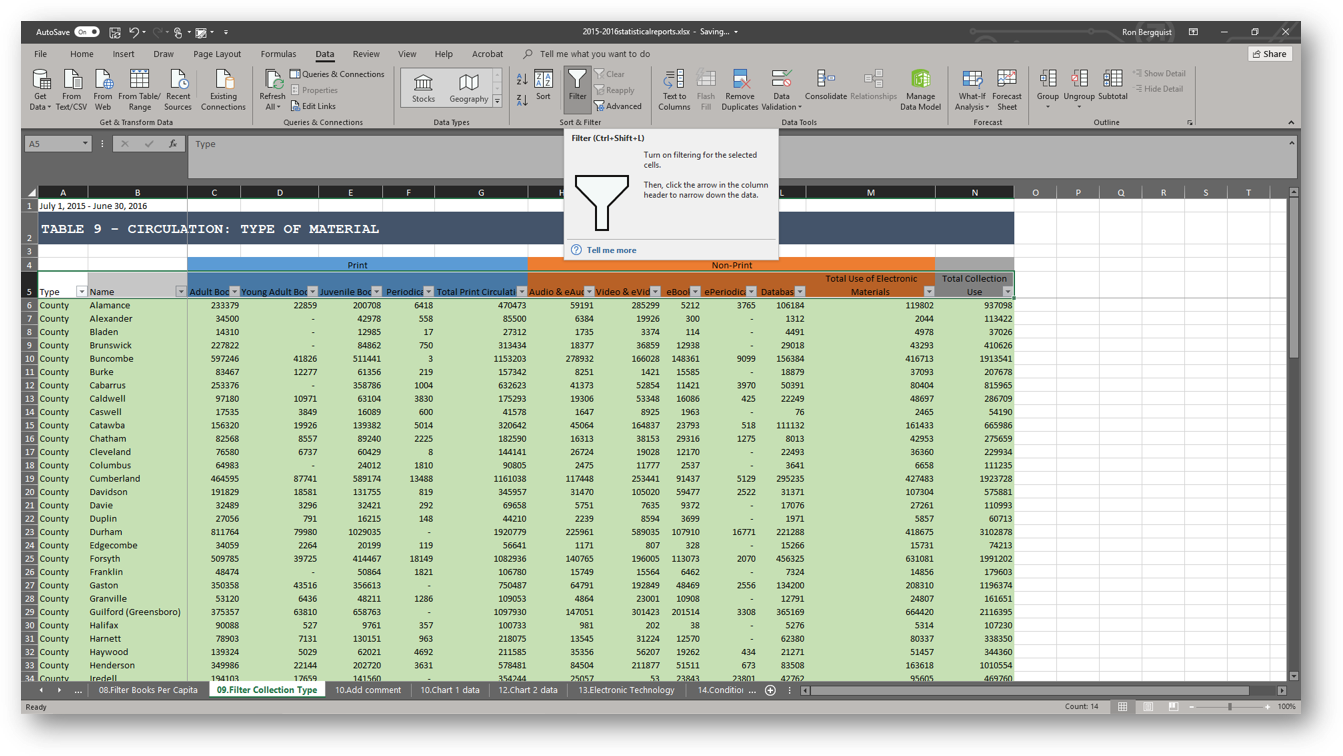
How to filter
Select Data > Sort & Filter > Filter from the ribbon. The filter will be applied to the column headings (which define the data in the rows below the heading row.
Using the Drop Down filter menu, select the entry that you wish to filter for (the result will hide all by the rows that include the filter term). It will either look down the column and filter for the argument-attribute it finds, or will allow you to create a custom filter for argument-attributes you define.
![[filter options from the drop down button on the header row]](images/spreadsheets.filter.options.png)
The same is true in Excel for Mac
![[filter options from the drop down button on the header row]](images/spreadsheets.filter.options.mac.png)
You can also create Custom filters (to do Boolean searches, for example). A dialog box will appear. If the argument-attributes in the column are text, the filter will be a text filter. If they are numerical, the filter will be a number filter.
![[custom filter dialog box]](images/spreadsheets.filter.custom.dialog_box.png)
Use the drop down menus (or type in) the filter you want.
Use filters to arrange data for charting or printing
Once you have filtered, you can create a chart based only on the displayed data. When you print, only the displayed rows will appear in the printed version (because the other rows are hidden). Should you choose to do additional formatting after having filtered, formatting commands will only affect the visible cells.
back to top
09 April lecture | preps | sorting | filtering | pivot tables