08 Nov 2018
Class Schedule
21 Aug | intro
23 Aug | clients
28 Aug | servers
30 Aug | networks
04 Sep | basics lab
06 Sep | structural layer
11 Sep | presentational layer
18 Sep | working with layers
20 Sep | behavior layer
25 Sep | images & design
27 Sep | website lab
02 Oct | object layers
02 Oct | graphics
09 Oct | document markup lab
11 Oct | spreadsheets, formulas & functions
16 Oct | thoughts about data display
18 Oct | Fall Break
23 Oct | database tools
25 Oct | spreadsheets lab
30 Oct | relational databases
01 Nov | tables
06 Nov | relationships
08 Nov | forms for input |
Task 05.03 |
reports for output |
Task 05.04 |
next session
13 Nov | SQL
15 Nov | complex queries
20 Nov | databases lab
22 Nov | Thanksgiving
27 Nov | presentation design
29 Nov | presentation delivery
04 Dec | presentation lab
13 Dec | 0800-1100 | final in class presentation

This work
is licensed under a
Creative Commons Attribution-NonCommercial-ShareAlike 3.0 Unported License.
home & schedule | class blog | syllabus | contact | grades
Reports allow you to create paper products that are the result of a restructuring of the underlying database.
What is a Report?
Access Guide to Designing Reports Help
You can build reports that pull data from several tables and present that manipulated data as a paper product.
It's a way to retrieve and present selected information stored in your database in a format that will be printed rather than viewed on a computer monitor.
- requires some thought about composition, about how they will look to the report user
- can be based on either a table or a query
- can combine text, data, pictures, lines, boxes, graphs, nd drawings to design exactly the output you need
back to top
Why use Reports?
Reports provide a snapshot of your database (or a part of your database) each time a report is generated. A well-designed report can be used over and over.
back to top
Generating Reports: Auto Report
If you want to create a simple report that is a duplicate of a particular table or (more likely) a simple select query, create a report based on that table.
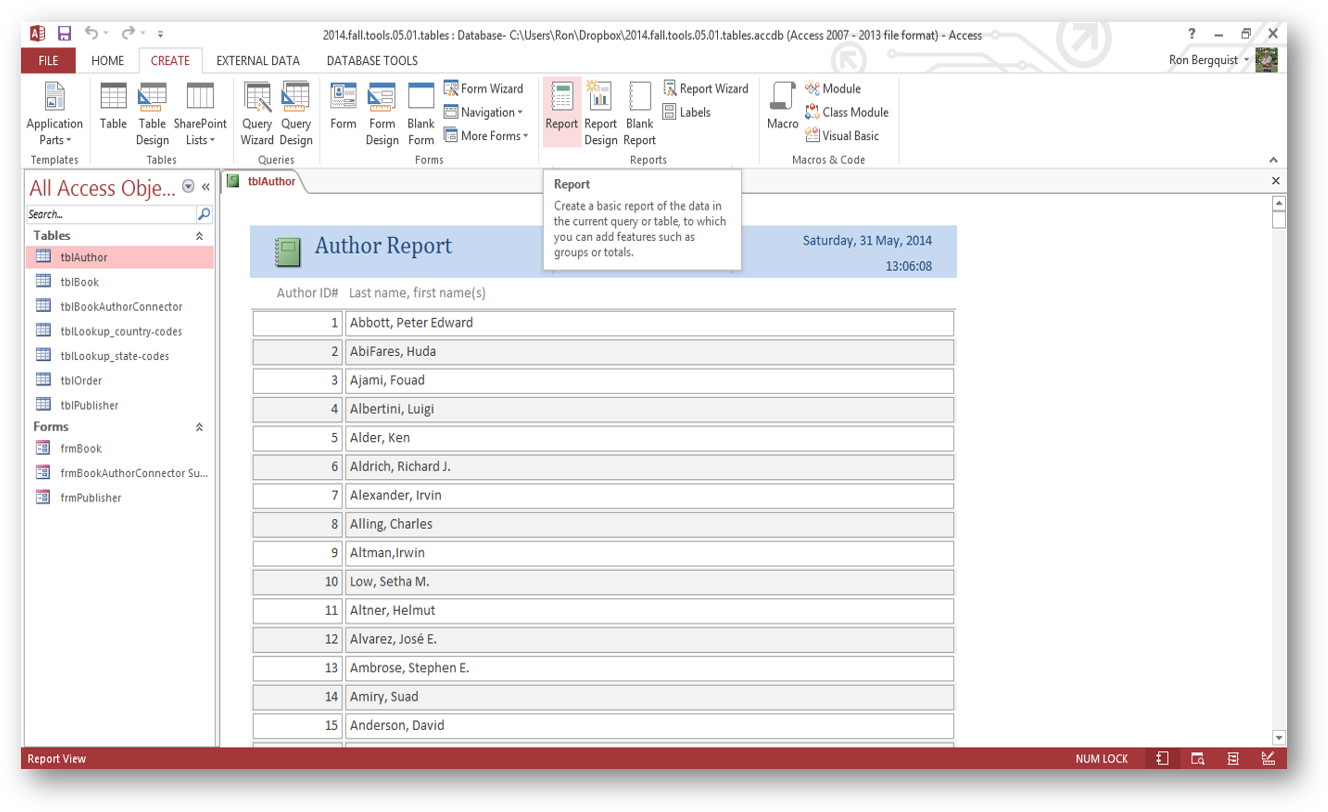
You then will see what the printed report will look like, but it might have taken some formatting work in the design view to make this happen.
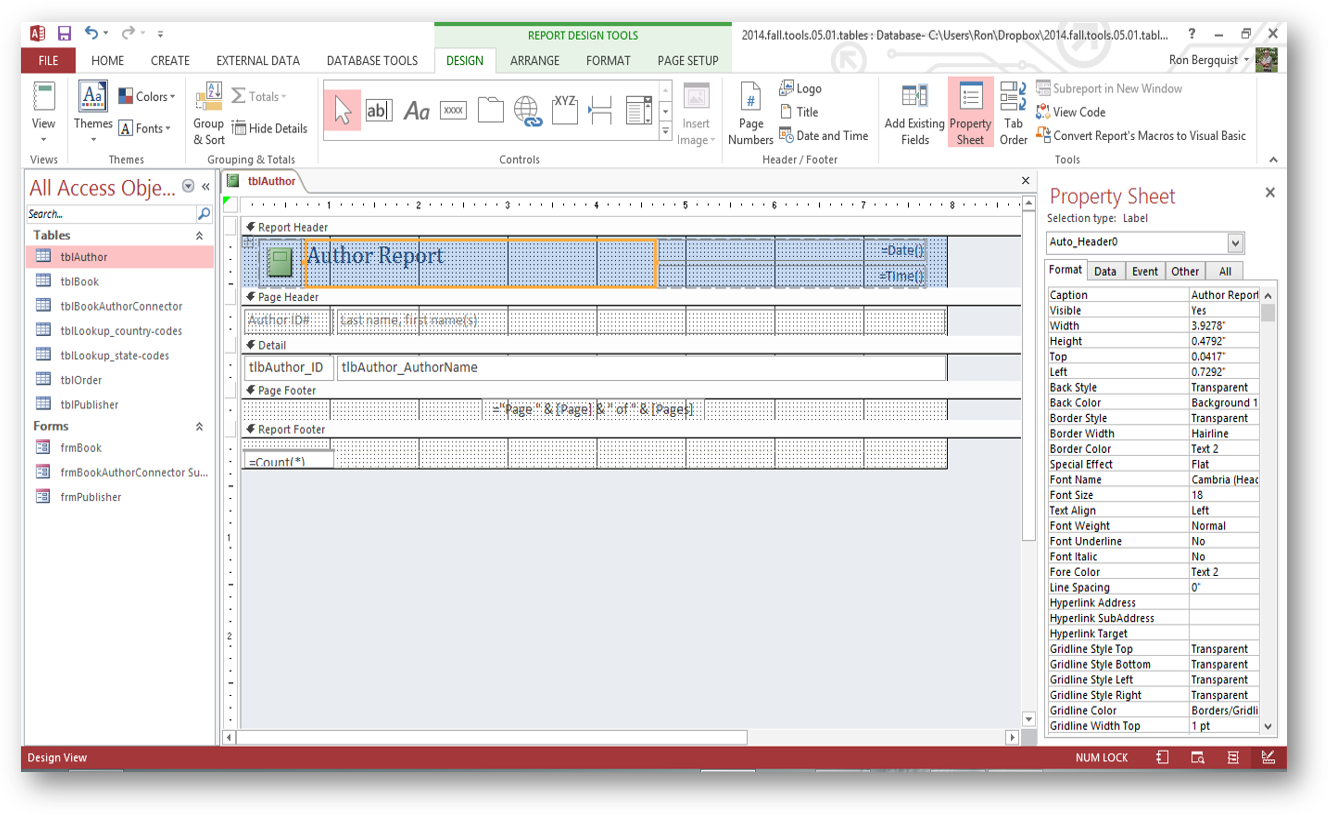
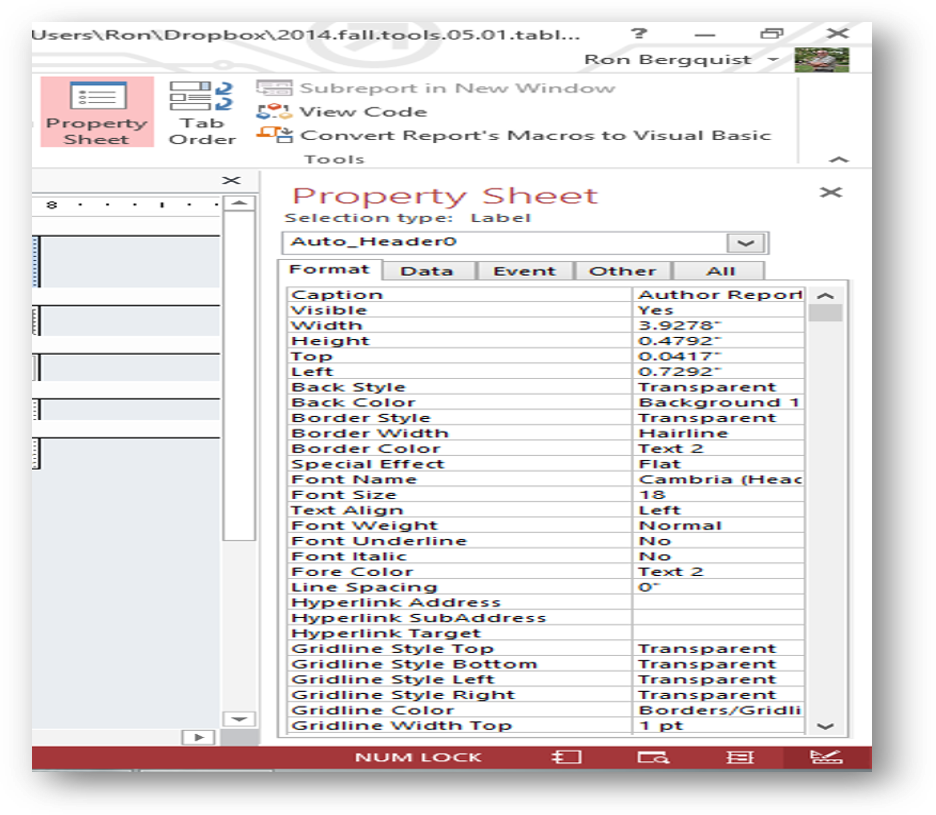
If you want to modify the report's appearance, you may do it in the WYSIWYG design view or you may choose to be more precise and exact by working within the report object's properties.
back to top
Generating Reports using the Reports Wizard
select the Wizard
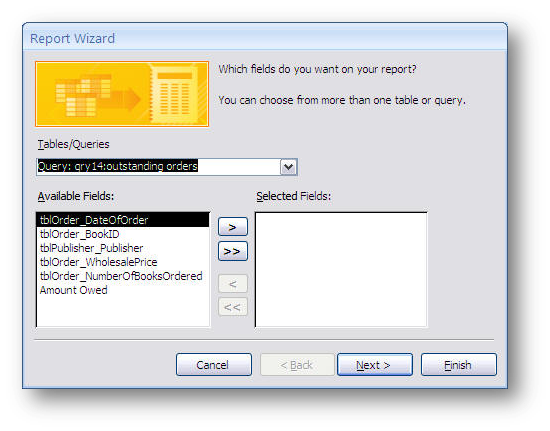
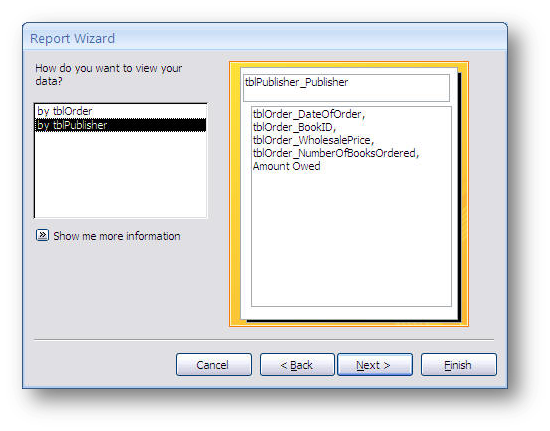
Using the Wizard dialog boxes, you can combine data from multiple tables and/or queries into a report. If you do use multiple tables/queries in the report, the Wizard will ask you to select the primary item on which the report will be based ...
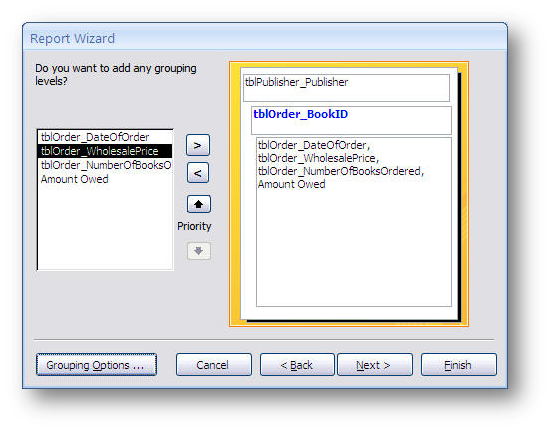
... and will ask you how you want the data grouped below the primary item ...
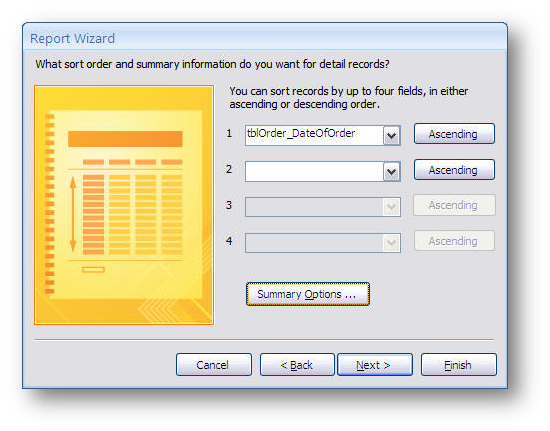
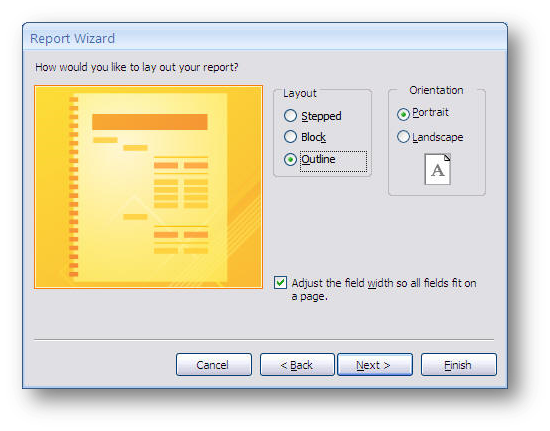
... and decide how to display the data in the sections of the report.
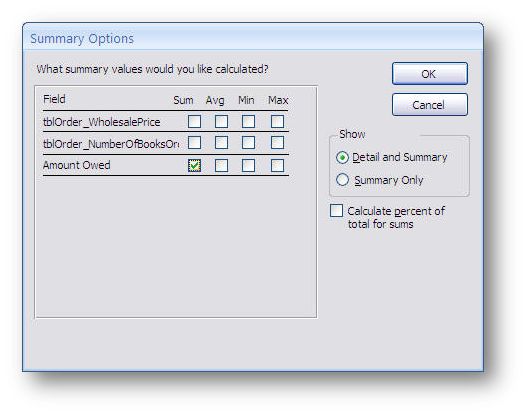
If the data can be manipulated by some sort of math operator, you will have the opportunity to perform summary operation in the form by selecting the appropriate option ...
... which will insert selected functions into the design.
It will then guide you through setting up the display properties ...
... and then carry you through the print view ...
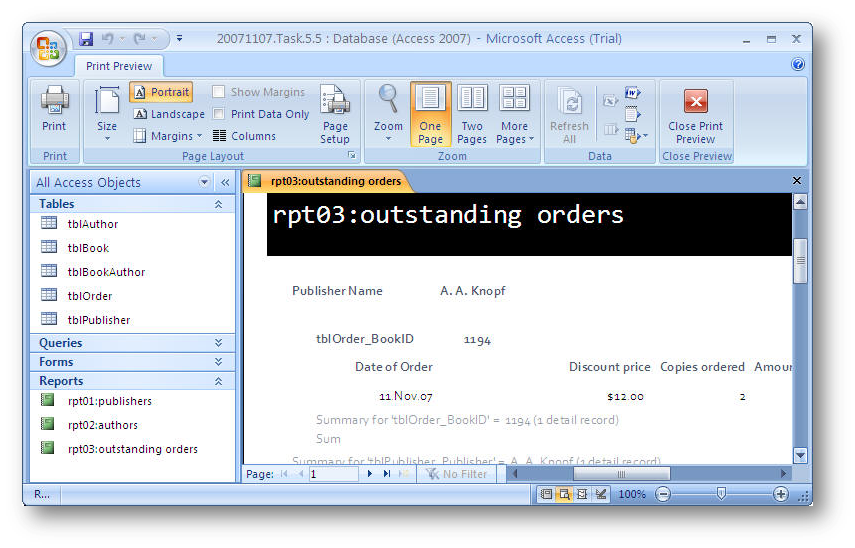
... from which you can alter the appearance by using the design view.
back to top
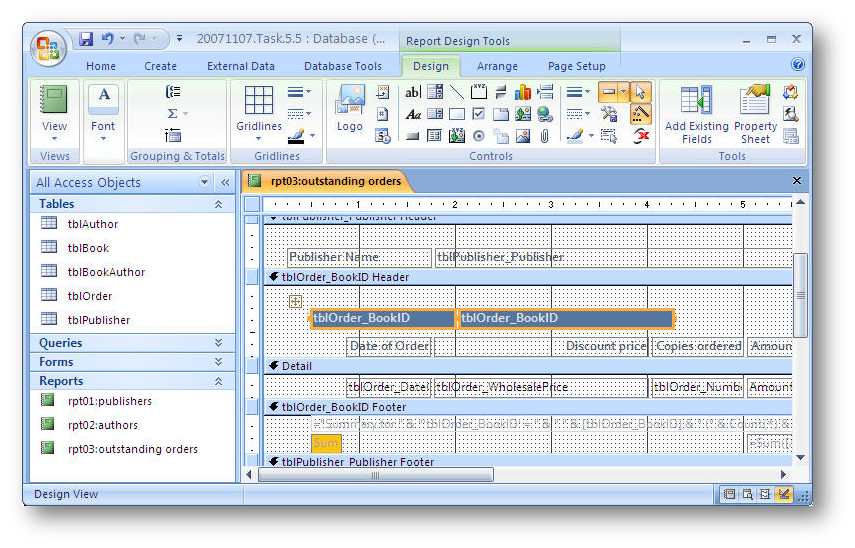
Report Components
Report Header
what appears at the top of the report
includes the title
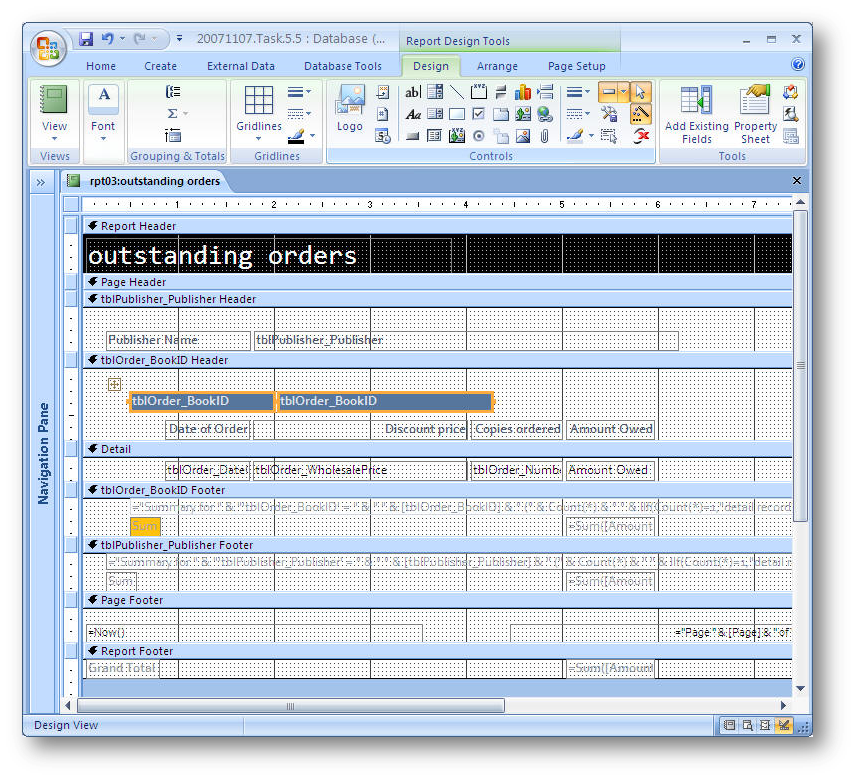
Page Header
what appears at the top of each page in the report
similar to showing the column headings on each page of an Excel printout
Group Header(s)
if the report is grouped, what appears atop each grouping of data
Detail
where the data from the tables/queries will appear
Page Footer
what appears at the bottom of each page
Report Footer
what appears on the last page of the report
back to top
Modifying Reports
You can add new components and functions to reports
see this short PPT show for one tool you need to have