| Why we do this | What we are to do |
|---|---|
| We will use vectors to source material for functions and formulas on the workbook you created on Wednesday. | Download this workbook from Canvas and use it for all three spreadsheet tasks (tasks04a, 04b, and 04c). then save it the space where you saved the workbook we are using for task04a. |
We will use the worksheets in this workbook (which these pages will refer to as external-data-source) as sources of data that we may pull into worksheets our task04a workbook.
| Why we do this | What we are to do |
|---|---|
| to demonstrate facility with formulas, by pulling vectored data from two different worksheets into a new formula |
Copy cells A1 through A51 from the US-states worksheet in the external-data-source workbook.
Paste these cells into cells B10 through B61 on the 05-Summary worksheet in your lastname_firstname_YYYYMMDD_task04a.xlsx workbook. Then, in cell E10 insert a formula that will draw values from two other worksheets in the external-data-source workbook. The formula should divide Alabama's "Y1991" values from the 17-medicaid expenditures worksheet in the external-data-source workbook (cell G2) by Alabama's "Y1991" values from the 18-medicaid aggregate worksheet in the external-data-source workbook (cell G10). |
![[MSExcel 2007+ sources for formula dialog box]](images/task04/spreadsheets.formula-sources.png)
| to demonstrate cell formatting skills based on the type of data the cells contain |
Once you have created the formula, format the cell to display percentages to two decimal places.
![[MSExcel 2007+ cell formatting dialog box]](images/task04/spreadsheets.format-percentages.png)
|
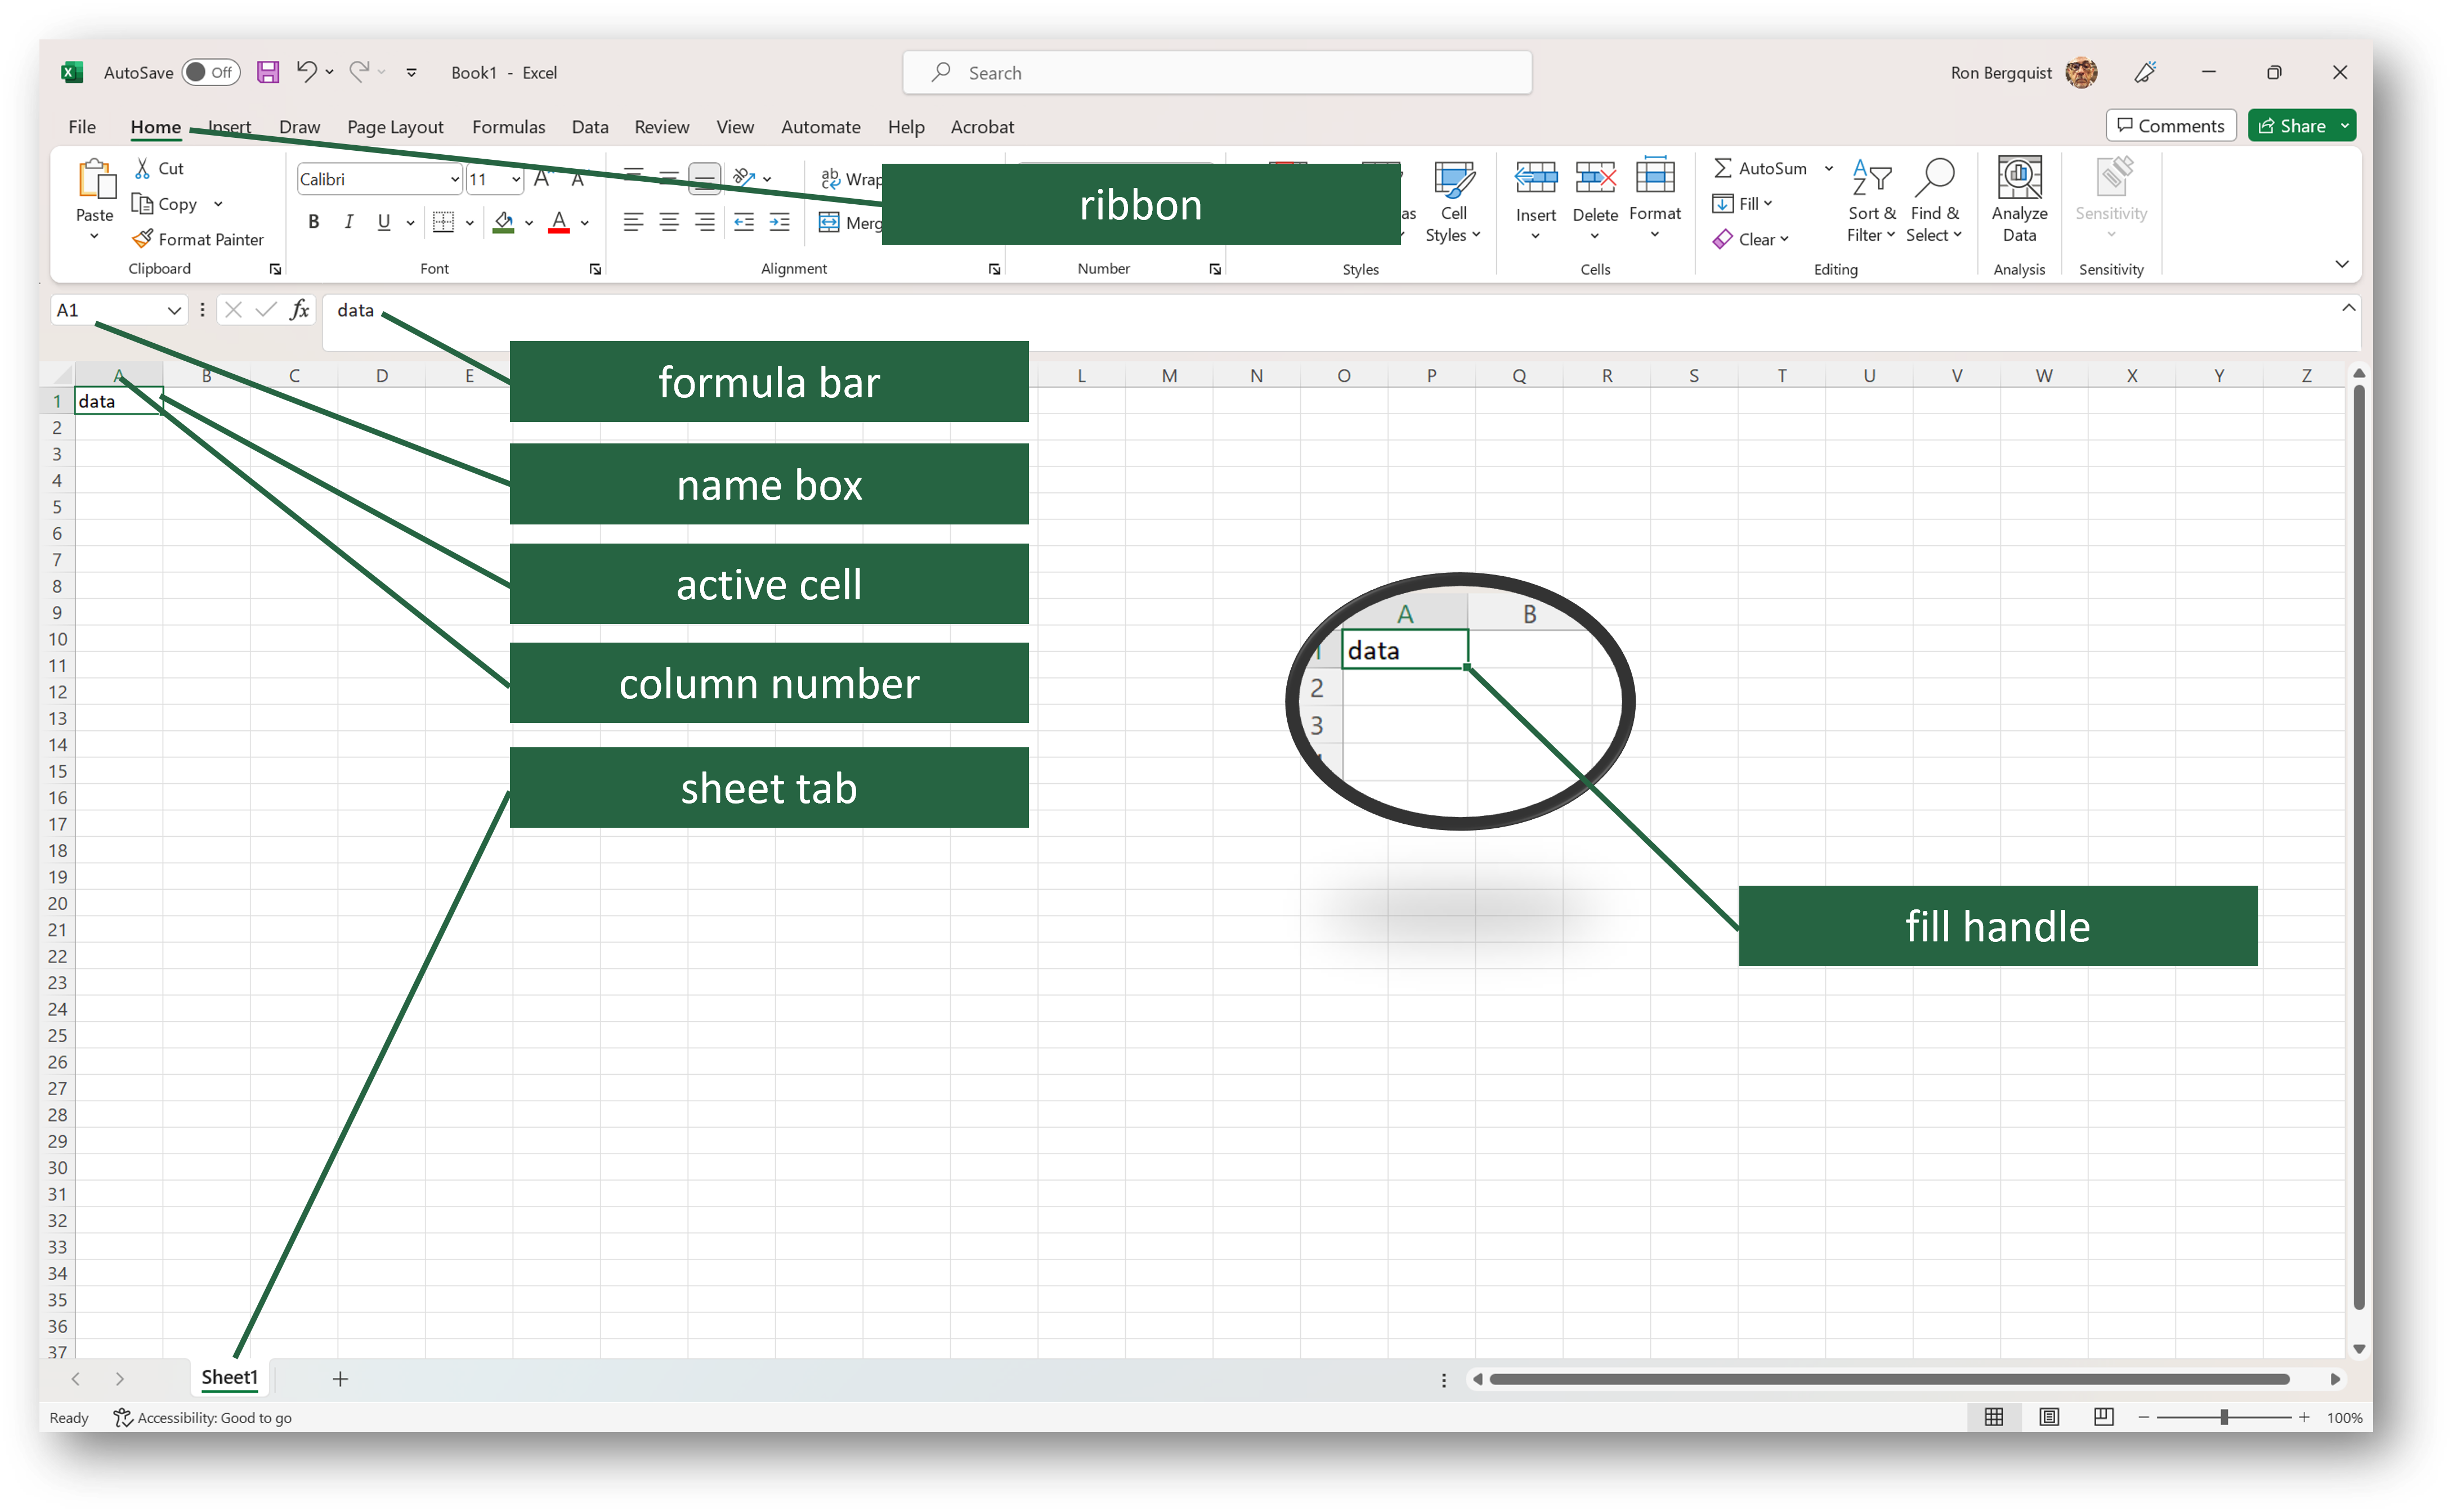
| to demonstrate understanding of how and why to drag formatting information from one cell to another | Once you have formatted the data in the cell, use the fill handle to drag the cell down the column, to apply the same relative formula and formatting for all states and Puerto Rico. |