Tools for Information Literacy
Pivot table practice
According to Microsoft
A PivotTable is an interactive way to quickly summarize large amounts of data. You can use a PivotTable to analyze numerical data in detail, and answer unanticipated questions about your data.
Another observer put it even more succinctly.
Pivot tables are summaries of your data based on categories that you select.
Still using your downloaded workbook ...
Create a Pivot Table from the 08-Inventory Worksheet
We will make a copy of a Worksheet and set up a PivotTable
The 08-Inventory worksheet is a good candidate for a PivotTable.
- There are a lot of text and categories in this sheet, and it would be clunky to use sorts and filters to summarize.
- It also appears that the text has at least some redundancy and errors.
- There are a lot of blank cells as well.
When you create PivotTables, you do not want the data to be messy, and you would want to first "clean" the data.
- However, cleaning data is a big job in itself, so we will instead use Pivot tables to help us identify some of the problems in this worksheet.
Step by step ...
- Make a copy of the 08-Inventory Worksheet and choose to move to end of the worksheets. After it is created, rename it 22-Pivot Table Data
- In the 22-Pivot Table Data select the header-row-5 data and the other data below. Do not include rows 1-4.
- On the ribbon, select Insert, and then click the PivotTable Button. A create PivotTable dialog box will open. Verify that the Table/Range shown in the Select a table or range Table/Range box is '22-Pivot Table Data!$A$5:$P$253
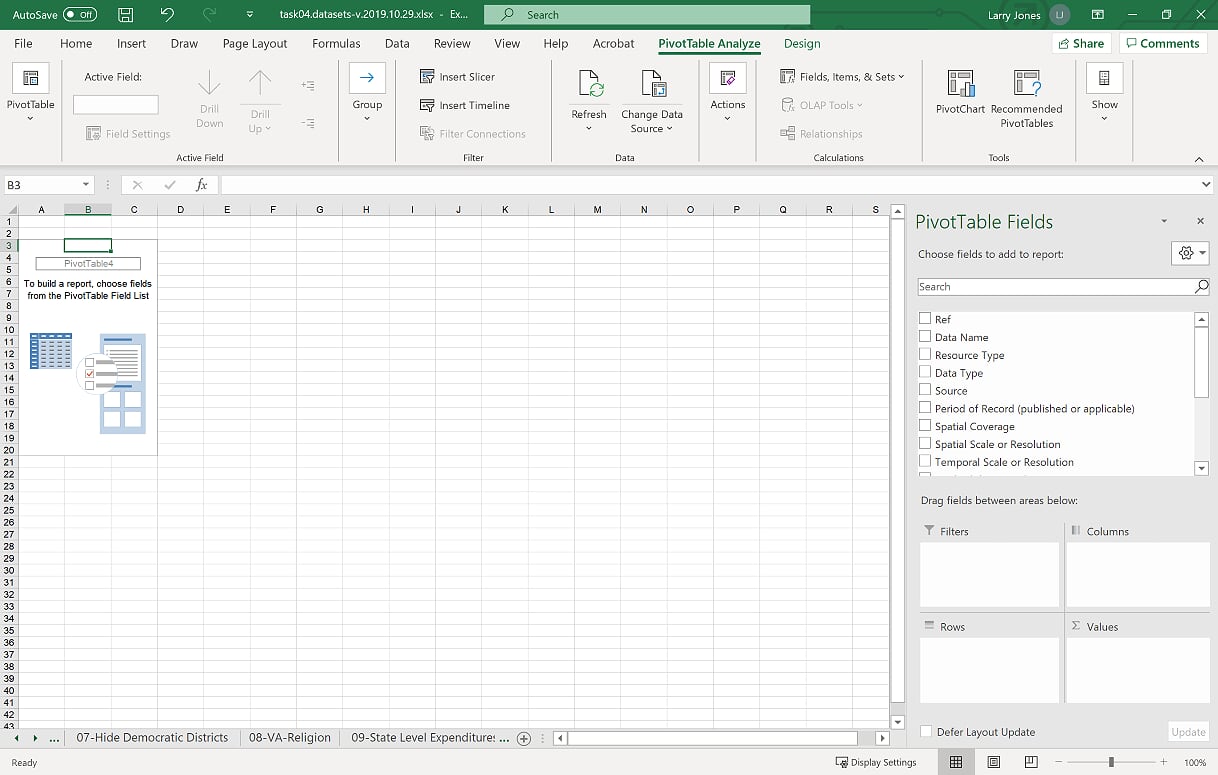
- Verify that New Worksheet is selected and click okay. A new sheet will be created. Rename the sheet 23-PivotTable Report.
Verify that you now have a blank PivotTable report located in the cells area on the left and that you have a Pivot Table Fields pane on the right.
create set up data add a filter
back to top
Set up the data in your Pivot Table
-
Inside of the Pivot Table Fields Pane, click the Ref box at the top of the box.
This will add Ref to the value area and also to your pivot table.
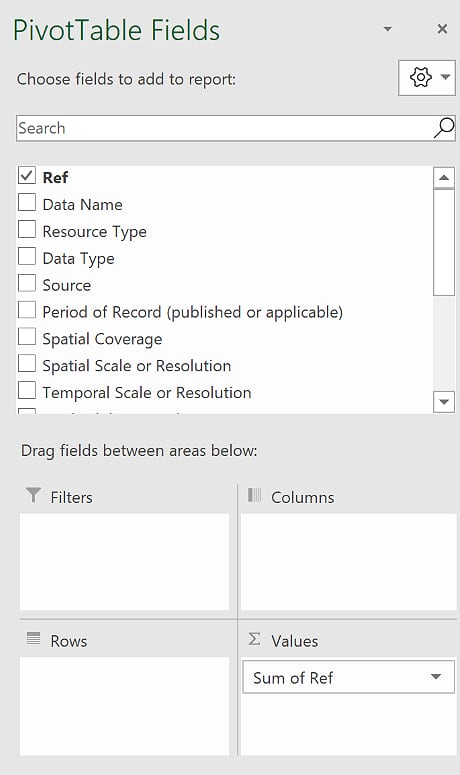
- Since Ref is a column of reference numbers, it should be not be totaled; it should be a COUNT. To change this to a count function, click on the down arrow to the right of Sum of Ref, and choose value field settings and then the count function.
- Next, drag the Data Name field into the Rows Area.
- Then drag the Availability/Distribution into the rows area above the Data Name. If you inadvertently drag it below, you can then drag it above after it is in the area.
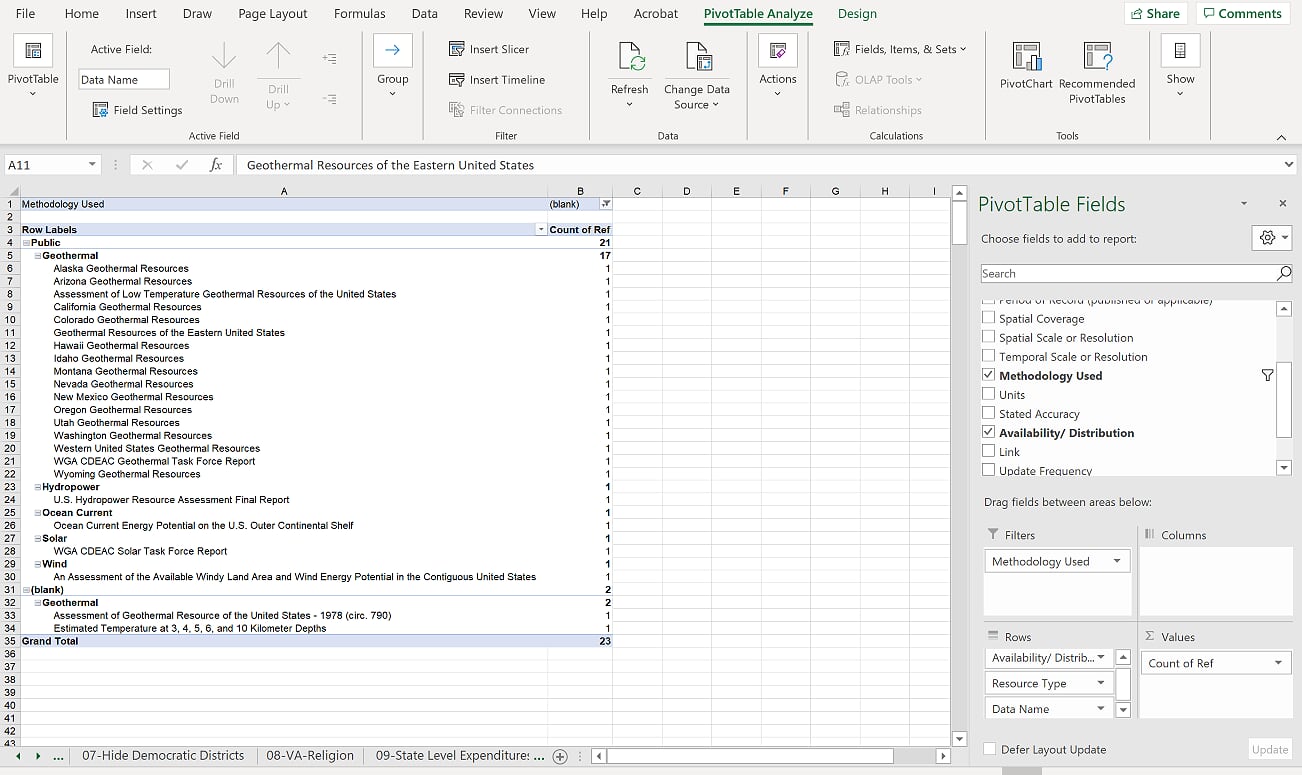
- Finally, drag the Resource Type into the Rows Area into the middle position. Here is what you should see now:
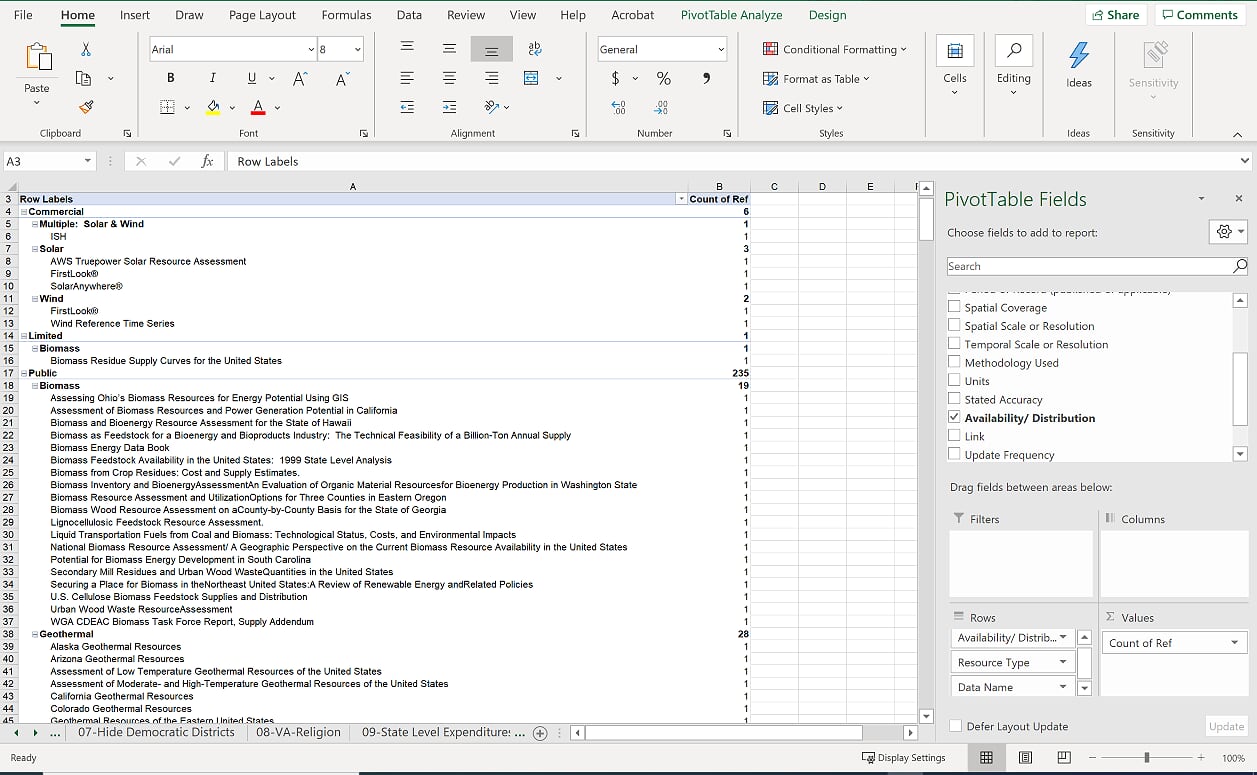
You now have a nice summary of important parts of your data.
create set up data add a filter
back to top
Add a filter
- Drag Methodology Used field into the Filters Area. Notice that you now have a filter added to the top of your Pivot Table Titled Methodology Used.
-
Select the filter dropdown and look at the first few Methodology fields in the dropdown list.
Notice the duplication of the data: Emperical Model vs. Empirical Model.
Emperical is a typo.
If you were cleaning this data, you would need to go back to the data and correct this.
It is important to understand that your pivot table will not dynamically update this correction.
Any time you must go change source data, you will need to refresh your PivotTable, just like you would refresh a web page to see the correction.
-
To finish this task, scroll down to the last field in the data and choose blank.
Your Pivot Table will now give you a report of all of the records that have a blank in the Methodology Used field.
create set up data add a filter