Tools for Information Literacy
Pivot tables
Pivot tables?
According to Microsoft
A PivotTable is an interactive way to quickly summarize large amounts of data. You can use a PivotTable to analyze numerical data in detail, and answer unanticipated questions about your data.
what are pivot tables? thinking about them making one
back to top
Pivot Tables
Another observer put it even more succinctly.
Pivot tables are summaries of your data based on categories that you select.
A PivotTable is especially designed for:
- Querying large amounts of data in many user-friendly ways.
- Subtotaling and aggregating numeric data, summarizing data by categories and subcategories, and creating custom calculations and formulas.
- Expanding and collapsing levels of data to focus your results, and drilling down to details from the summary data for areas of interest to you.
- Moving rows to columns or columns to rows (or "pivoting") to see different summaries of the source data.
- Filtering, sorting, grouping, and conditionally formatting the most useful and interesting subset of data enabling you to focus on just the information you want.
- Presenting concise, attractive, and annotated online or printed reports.
But why?
A pivot table is a table of statistics that summarizes the data of a more extensive table (such as from a database, spreadsheet, or business intelligence program). This summary might include sums, averages, or other statistics, which the pivot table groups together in a meaningful way.
Pivot tables are a technique in data processing. They enable a person to arrange and rearrange (or "pivot") statistics in order to draw attention to useful information.
what are pivot tables? thinking about them making one
back to top
It begins with deciding what to display.

- Select the cells you want to create a PivotTable from.
Your data shouldn't have any empty rows or columns. It must have only a single-row heading.
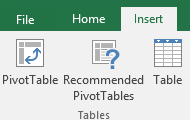
- From the ribbon, insert the pivot table.
- Under Choose the data that you want to analyze select Select a table or range.
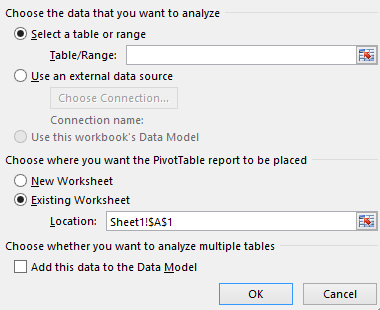
- In Table/Range, verify the cell range.
- Under Choose where you want the PivotTable report to be placed, select New worksheet to place the PivotTable in a new worksheet or Existing worksheet and then select the location you want the PivotTable to appear.
They are easy to make and allow one to generate subsets of data to use for particular tasks, without having to recreate a new worksheet or data set. But the challenge is to understand what we want to see and how we want to analyze it in the Pivot Table.
what are pivot tables? thinking about them making one