|
|
|
Stephanie W. Haas, Maria Cristina Pattuelli, |
|
Ron T.
Brown, Jesse Wilbur |
|
|
|
School of Information and Library Science |
|
University of North Carolina at Chapel Hill |
|
{haas, browr, pattm}@ils.unc.edu,
jdwilbur@email.unc.edu |
|
http://ils.unc.edu/govstat |
|
|
|
Supported by NSF grant EIA 0131824 |
|
|
|
|
|
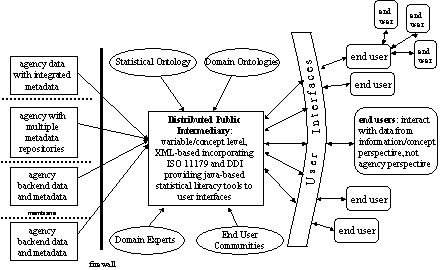
Government statistical agencies are a rich
source of information, but many barriers
to their use, especially by non-experts, exist. |
|
Statistical Knowledge Network |
|
integrate information across agency boundaries |
|
provide alternate means of finding and viewing
information |
|
provide help when, where, and how it is most
useful |
|
|
|
|
|
|
|
Lack of statistical knowledge leads to
difficulties: |
|
searching |
|
recognizing relevant statistics |
|
choosing the most appropriate statistics |
|
understanding what is presented |
|
using and interpreting the information |
|
|
|
|
Why are there so many numbers for employment and
unemployment? Does it matter which
I use? |
|
The table lists mean and median income – which
number is right? |
|
I’ll use the seasonally unadjusted number,
because I just want one number, not a set for each season of the year. |
|
The “E” means it’s an estimate – they don’t know
the real number. |
|
Can I compare a seasonally adjusted number to an
unadjusted number? |
|
|
|
|
|
|
User’s purpose is to find information, not learn
more about statistics |
|
Seeking help shouldn’t mean abandoning the task |
|
Help should be integrated as seamlessly as
possible into the statistical resources |
|
|
|
|
Limited coverage of concept and terms |
|
Intended for “everyday users”, not experts |
|
Provide explanations in variety of forms |
|
Explanations must be attractive |
|
Explanations should be coordinated with content
– context specificity |
|
|
|
|
|
|
|
Frequently encountered terms |
|
Basic level of statistical literacy |
|
Strategies for term identification |
|
examination of frequently-visited pages |
|
anecdotal evidence from agency and non-agency
consultants |
|
metadata user study |
|
web crawl of agency sites |
|
|
|
|
|
Basic level of explanation |
|
Variety of delivery “packages” |
|
definition, example |
|
brief tutorial, demonstration |
|
interactive simulation |
|
combination |
|
May incorporate related terms and concepts |
|
May point to more advanced resources |
|
|
|
|
|
|
|
Incorporate explanations in user’s work context |
|
table- or statistic-specific, e.g., CPI, death
rate, gasoline prices, etc. |
|
agency- or concept-specific, incorporating
relevant entities, e.g., employment, benefits, height and weight, etc. |
|
general, universal context |
|
|
|
|
|
|
|
Minimal interruption to user’s task |
|
Inform user that help is available for a term |
|
Allow user to select help presentation(s) |
|
Allow user to control action |
|
start, stop, repeat, supply values, etc. |
|
Allow user to explore related terms (ontology) |
|
|
|
|
|
Scope of glossary plus connecting concepts and
relationships |
|
Taxonomic relationships support |
|
provision of context-specific or more general
explanations |
|
concept explanation templates |
|
Domain relationships support |
|
combining related concepts in explanation |
|
integration business rules |
|
|
|
|
|
|
|
Evaluation of ontology and SIG |
|
User exploration of statistical concepts and
terms in ontology |
|
Connections to GovStat Metadata Model |
|
Services for information integration business
rules |
|
Extending context-specific help |
|
domain terms for statistical agencies |
|
other arenas |
|
|
|
|
|

 Notes
Notes