-
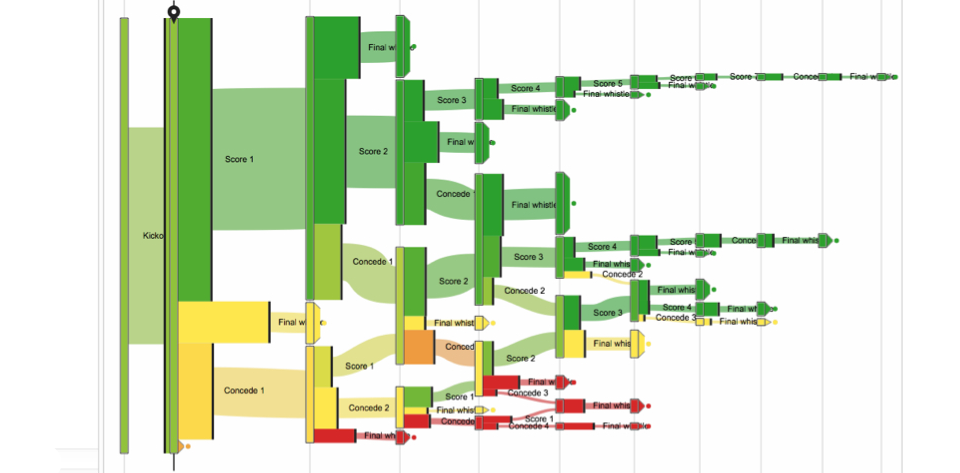
Outflow Temporal Visualization
http://gotz.web.unc.edu/research-project/outflow/ -
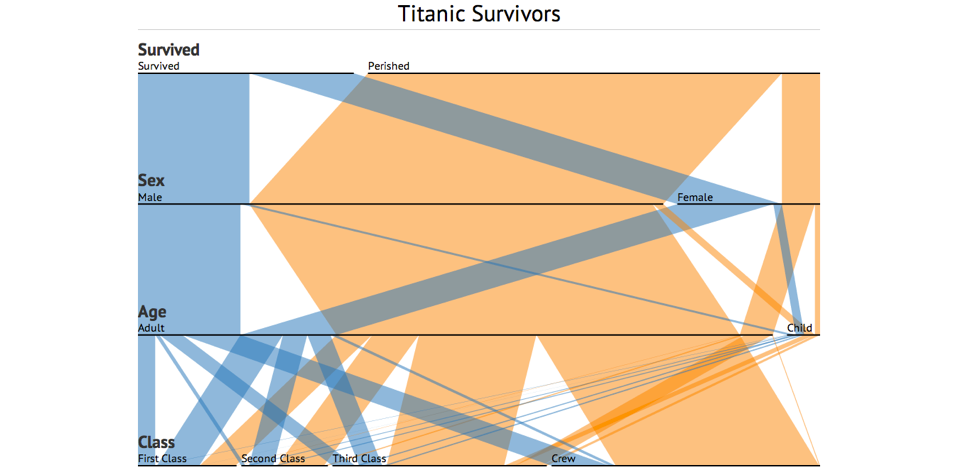
Parallel Sets
http://www.jasondavies.com/parallel-sets/ -
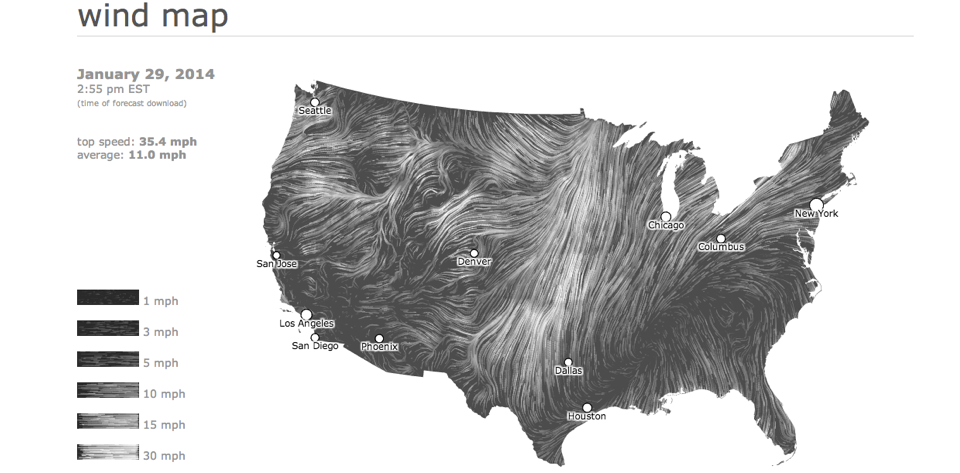
Wind Map
http://hint.fm/wind/ -
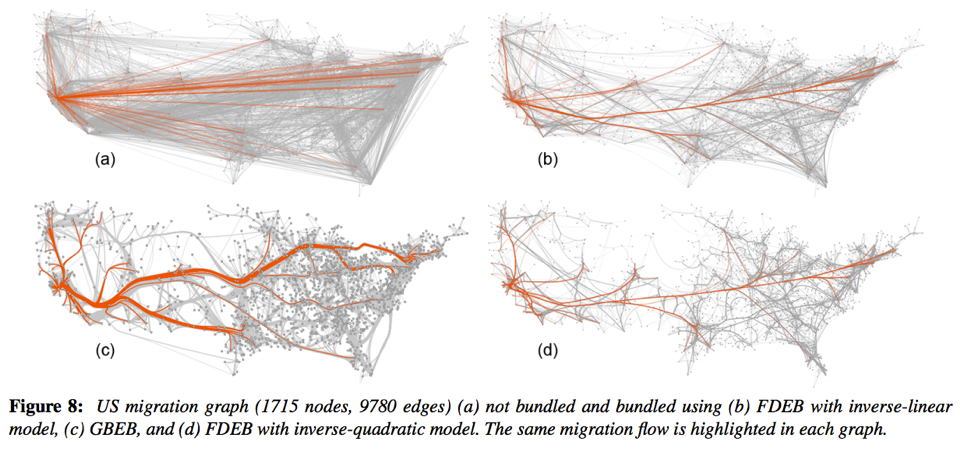
Edge Bundling
http://www.win.tue.nl/~dholten/papers/forcebundles_eurovis.pdf -
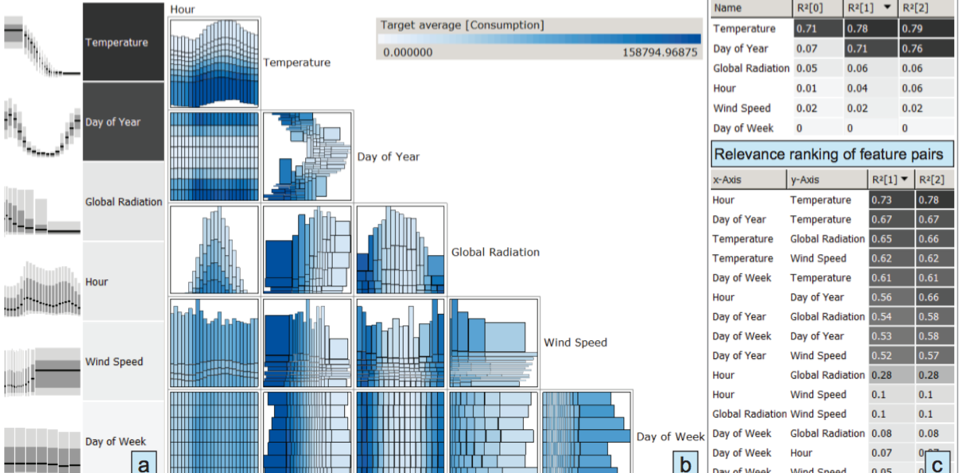
Regression Modeling and Validation
http://www.vrvis.at/publications/pdfs/PB-VRVis-2013-019.pdf
Visual Analytics
"The science of analytical reasoning facilitated by visual interactive interfaces."
-Thomas and Cook. Illuminating the Path: The R&D Agenda for Visual Analytics. 2005.WELCOME
Welcome to INLS 641. This course, offered by the UNC School of Information and Library Science, will provide an overview of Visual Analytics, a topic that combines information visualization and data analysis to support analytical reasoning via highly interactive visual interfaces. The course will review foundational concepts, recent research results, and commonly used technologies. The course is project-oriented and will require that students program their own web-based visualization systems using HTML and JavaScript.
While no specific courses are considered prerequisites, students should be competent programmers. Prior experience with web programming (e.g., HTML and Javascript) is strongly recommended. If you are unsure about your readiness to take this course, please contact the instructor.
COURSE INFORMATION
Time: Tue/Thu, 9:30-10:45Place: Manning Hall Room 014
Credits: 3 hours
Instructor: David Gotz
Office: 201 Manning Hall
Phone: 919.962.3435
Email: gotz at unc dot edu
Office Hours:To prevent crowding, office hours will require an appointment. Time is typically available on Tuesdays, Thursdays, and Fridays with additional times that vary from week-to-week. You can make your own appointment via this page. Office hours will by default be held over zoom. Face-to-face office hours can be arranged on an individual basis when needed. Be sure to communicate with the instructor if you need to meet face-to-face. Again, Zoom appointments will be the default meeting format for office hours this semester.