Summary and Comparative Analysis
by
[Editor's note]: The figures in this web-based text have been redrawn from the print version to provide color. This has also resulted in the order of presentation which has been changed from descending to ascending. Also, for a complete listing of schools that submitted data for this year's report, please click the list of schools.
Introduction
The Library and Information Science Education Statistical Report is not intended to be colorful or dramatic. It is intended to let library-school communities know their standings relative to peer communities in key areas, especially towards accreditation time, and to give them national benchmarks (e.g., for salaries or faculty size) against which local conditions and practices might be judged. The Report is also intended to summarize data aggregated for most, if not all, of the library and information science programs in the United States and Canada — statistics that bear on the state of LIS education at a particular time. These aims have been variously addressed in the "Summary and Comparative Analysis" chapter in previous annual issues. In last year’s issue, for example, Evelyn Daniel provided a template of observations and extracts from other chapters that may be updated with this year’s data by anyone wanting specific information in her categories (Daniel, 1997). Here, I have chosen to let the other chapter authors summarize their own data, in order to react to the idea of "Summary and Comparative Analysis" itself, somewhat in the vein of earlier critiques (Hannigan, 1990; Woodsworth, 1994), but at an even more general level.
I want to ask: how can we make the Report more interesting?
Human Interest and Descending Sorts
When schools appear in the tables of the Report, an ascending sort on the leftmost column puts their names in alphabetical order — the arrangement of many thousands of reference works. This makes the entries for individual schools easy to look up. But it also has a subtle political effect, in that, by jumbling the numeric data in the columns to the right, it retards invidious comparisons. In contrast, imagine a descending sort on some numeric column: the schools would be rank-ordered high to low, and one could see at a glance who was on top and who was at bottom.
Everyone knows why such rankings are not done. Organizations like ALISE are not in the business of vexing members, and it is safer to err on the side of egalitarianism than to appear to be pointedly fostering distinctions. (Tables in the U.S. Statistical Abstract probably alphabetize American states for the same reason) But the result is the humdrum quality of the Report as a serial. Its human interest potential is low because it so resolutely avoids the horse-race aspects of the data.
Nevertheless, the data are there for the ranking; ALISE, to its credit, makes such analyses possible even if it does not do them itself. Hence, we can begin to discuss what variables might be singled out for rank-ordering because of their intrinsic interest to LIS educators. Given a choice between this year’s Library and Information Science Education Statistical Report and Gale’s 1998 Educational Rankings Annual, I dare say that not even LIS educators would hesitate to browse the latter first, especially if they learn it has a section on library science. The Annual responds to people’s common and permanent interest in superlative cases (the most, the least, and so on); recall that the ever-popular Guinness Book of World Records used to be called the Guinness Book of Superlatives. If one wants to distinguish "data" from "information"—as teachers in LIS well might—one could do worse than to illustrate "data" with an alphabetized table from the Report and "information" with the same table ranked, in the manner of the Annual. "Data become information," I once wrote, "by being marshaled on behalf of the questioner or interessee" (White, 1992, 259). If so, there will always be far more people who want to know what is top-ranked in any list than who want to know, say, how many men in some ALA-accredited master’s program held assistantships in 1996.
In a sense I am advocating what might be called the Guinness approach to selected items of data: find the high-interest variables in the Report, and rank-order them to highlight contrasts. Prompted by one’s own sense of curiosity, try to guess what would rouse the curiosity of others. If one wanted a journalist to do a story on the Report, what findings would one point to? If one wanted two or three of its numbers to appear in the Harper’s index (see any issue of Harper’s Magazine), what would they be? At present not much leaps to the eye as newsworthy, but that is not necessarily because there is no news. The stories may simply be masked. Not only do the Report’s tables seem designed to be as undramatic as possible; one also notes an absence of graphics, with their well-known powers of eye-catching summarization (an exception is Sineath, 1991). Thus, graphical rather than tabular presentation has to be urged as well. Without graphics, it is hard to discern either typical or unusual school performance on an annual basis, and next to impossible to monitor multi-year trends (cf. Hannigan, 1990, 278).
The Social Indicators Approach
Like some of my predecessors in writing this chapter, I note a disparity between the amount of labor that goes into compiling the Report (both in individual schools and at the ALISE editorial level) and the likely audience for many of the tables. There may indeed be times when, at the micro-micro level, someone needs to know the count of men in assistantships at some school. I am more struck by what happens at the macro level. The 1993 author of this chapter, Leigh Estabrook, is the dean of a very prestigious library school at the University of Illinois—certainly, one would think, an ideal appreciator of the tables. Yet even she wrote, "Despite the latitude of style offered me by the editor...I have found it extremely difficult to write this summary and comparative analysis" (Estabrook, 1993, 323). In truth, the fault is not hers. Were the Report better designed at the macro level, there would be much less doubt as to what statistics to extract and compare. The summary chapter might even be omitted; the key indicators could simply be presented once to speak for themselves: look at what OCLC does in its annual reports with a few well-chosen graphics and a bit of commentary.
By "macro level," I mean the choice of variables to present. Obviously, some tables in the Report do not admit of ranking (e.g., listings of joint degree or certificate programs in the Curriculum chapter), and others, while technically rankable, would not thereby become more interesting. My concern is less with rankability per se than with the proliferation and overelaboration of data—multi-page tables with huge numbers of empty or near-empty cells and tables whose design leads to footnoted minutiae. The ranking of schools proposed here is really a way of pruning the variables. If a high rank is associated with distinction, with being notable for something, then rankings focus our attention on what kinds of notability are really important to LIS educators. If a high rank simply makes us scratch our heads, then that variable is a candidate for elimination. I would question, for example, whether the tables on student enrollments by age yield useful insights even when we learn, through ranking, what schools have the most students in particular age groups. Of course, there usually is anecdotal evidence that someone, somewhere, has asked for just such data, but that does not justify publishing them indefinitely. Let us be hard-nosed and ask: "Is this something they really need at Illinois? How will this help them at Alberta?" Or look inward and ask the hardest judge of all: "Is this something I care about? I, who love the profession and my school’s fair name?"
Pruning is necessary if the Report is to feature fewer, but more policy-relevant indicators, graphically displayed. A generation ago, when talk of social indicators was first fashionable, this definition appeared: "A social indicator may be defined to be a statistic of direct normative interest which facilitates concise, comprehensive and balanced judgments about the condition of major aspects of a society" (U.S. Department of Health, Education, and Welfare, 1969, 97). The spirit of this definition could guide the reconstitution of the Report, or a summary publication derived from it, as ALISE indicators. Alternatively, if the Report remains unchanged, ALISE has the option of posting its tables as downloadable files on a Web site. This makes them available for secondary analysis and graphical rendering by anyone seeking upgraded information.
Key terms in the definition quoted above are "normative," connoting a shared vision of what ought to be, and "major." One wants a consensus on the nontrivial. In my view, the two most powerful questions in shaping that consensus would be:
• What are the marks of the best programs in LIS?
• What are the marks of health in LIS education?
These are questions of the "social indicators" type, in that they force one to choose among many competing streams of data; their aim is to conserve attention, to simplify what will be heeded. Their implication for the overworked staffs in library schools is drastic: if the data do not speak directly and persistently to educators with these concerns, do not collect them.
The other side of this proposition, of course, is that some indicators are indeed worth creating and publishing. There is no doubt whatever that they cannot capture education at its most fundamental level—the level where personal change takes place, for good or ill. They miss individual failures in the strongest LIS programs and individual successes in the weakest. Still, they are the only way we have of rising above anecdote, so that broader patterns emerge. They are also the best way to provoke useful questions—questions that lead to explanations of why something is the case.
The Best Programs
Not long ago, a list of America’s top 10 LIS programs, based on a survey of faculty and administrators, was published by U.S. News & World Report ("A Brand-new World," 1996):
| Program |
Rating |
| University of Illinois |
4.4 |
| University of Michigan |
4.3 |
| University of North Carolina, Chapel Hill |
4.3 |
| Syracuse University |
4.2 |
| University of Pittsburgh |
4.1 |
| Indiana University |
3.9 |
| Rutgers University |
3.9 |
| University of Wisconsin, Madison |
3.9 |
| University of Texas, Austin |
3.8 |
| Drexel University |
3.7 |
This was a story that, unlike earlier, similar rankings, broke outside the library press; it has since been relayed in the publicity of more than one of the programs listed. People now talk about "wanting to stay in the top 10" or "making the top 10" if they are not there already.
While insiders may criticize this ranking on several grounds, it remains useful as a gauge of perceived quality in the mid-1990s. Since ALISE members were respondents in the survey, one may wonder which of ALISE’s own statistics, as given in the Report, best predict membership in the top 10. I shall briefly explore, with graphs, five possibilities from the data for academic year 1996–97: cost of tuition, size of master’s degree program in LIS, income, faculty size, and overall student-body size. The intent is to focus L&IS educators on which of the Report’s variables are truly important. (These five would almost certainly make the grade) Mulvaney (1992) has a further, highly relevant discussion.
Figure 1 below shows the schools in which the ALA-accredited master’s degree currently costs at least $10,000. All are private except Michigan, Pittsburgh, and Maryland. Only Drexel, Michigan, and Syracuse from the top 10 are among the most expensive 10, and so cost of tuition is not a good predictor of subjective esteem.
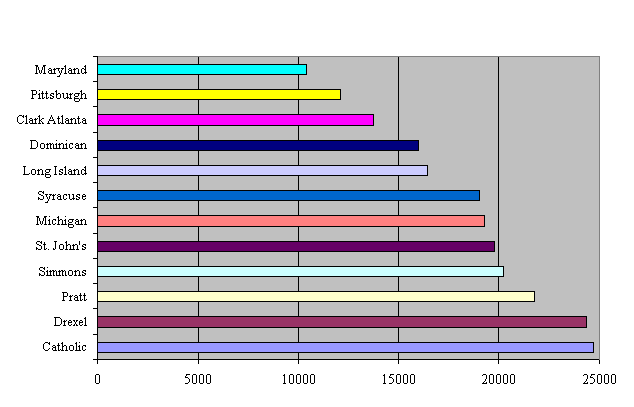
Figure 1. Twelve Costliest Degrees (in Thousands of
Dollars)
Source: Table II-13-c-2
It would be interesting to know how many LIS faculty—or students—know where their school stands relative to other schools in cost of degree. I always knew Drexel was expensive, but it was not until I examined the Report a few years ago that I learned just how expensive it is. The wide variation in costs of LIS programs has not, so far as I know, received much comment in the profession, but the time may be ripe for it.
Figure 2 reveals the largest programs in raw counts (not full-time equivalents) of students in ALA-accredited master’s programs. To put the counts in perspective, for the 56 schools reporting this year to ALISE, the average number of students in such programs is about 223.
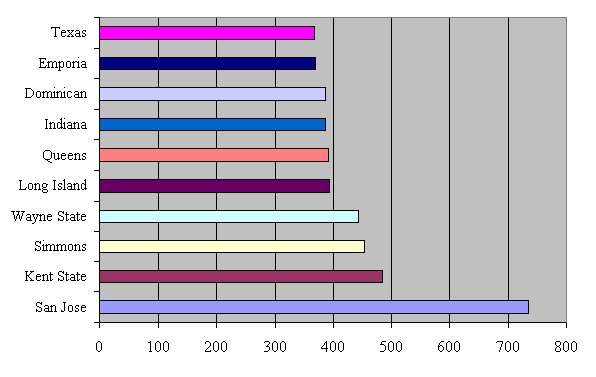
Figure 2. Ten Largest Student Bodies in ALA-Accredited
Master’s Degree Programs
Source: Table II-1-c-2a
Only two of the top 10, Indiana and Texas, appear in this ranking; again, this variable is not a good predictor. Note that Simmons, Long Island, and Dominican appear in both Figures 1 and 2, implying that relatively high tuition is not necessarily a bar to high enrollment.
The student body size of San Jose State is remarkable, yet, in my parochial circles, no colleague has correctly identified it as the largest LIS program in the United States. The reasons for its present size are of considerable interest. Is it the very large off-campus program it runs (258 FTEs)? Proximity to Silicon Valley? The recent reorganizations of UC Berkeley and UCLA? The absence of other programs for school librarians in California? The story awaits unfolding.
Income, as shown in Figure 3, is obviously a much better predictor than the first two of elevation to the top 10. This variable does not put the programs in the same rank order, but it matches the list in U.S. News & World Report for nine schools out of 10. (The exception is Tennessee, instead of Wisconsin Madison) This variable also has the merit of being objective.
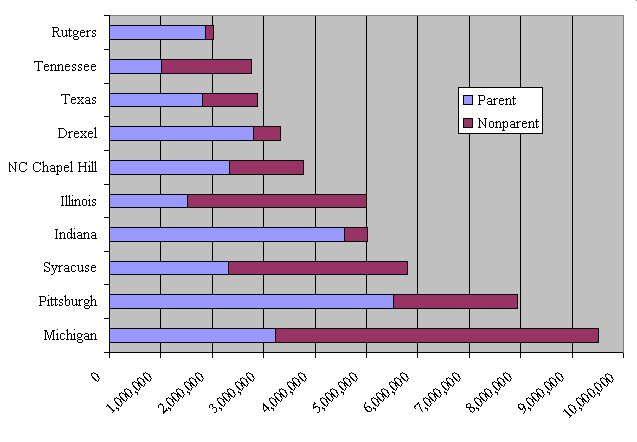
Figure 3. Ten Highest Total Incomes
Source: Table IV-19
The darker part of the bars shows the share of income contributed by the parent institution; the lighter, the share from sources other than the parent. Michigan, Syracuse, and Illinois, for example, are notable for their external grants; Pittsburgh and Indiana, for their institutionally based funding. Much more could be done with this variable, such as plotting its components over time.
It is not surprising that LIS educators take high income as the foundation of prestige. But Figure 3 is evidence that income may be the best single explanation of why the 1996 top 10 looks as it does. Raters in the U.S. News & World Report survey probably lacked hard numbers, but they nevertheless seem to have formed roughly correct impressions. They of course took other factors into consideration as well.
With Figure 4, we can see that faculty size is also a good predictor of subjective esteem. Eight of the 12 largest faculties are at schools in the top 10. As reported for fall term, 1996, all 12 of these faculties have at least 13 full-time members. This sets them apart, since full-time faculty counts for ALISE schools have long averaged around 11. Part-time faculty members, converted to full-time equivalents, have been added to each school’s total (Rutgers’s true rank is not known; its data on part-timers are missing). The largest totals are seen for Pittsburgh and Indiana, programs that, in Figure 3, lead in shares of income from their parent institutions, presumably much of it money for faculty salaries.
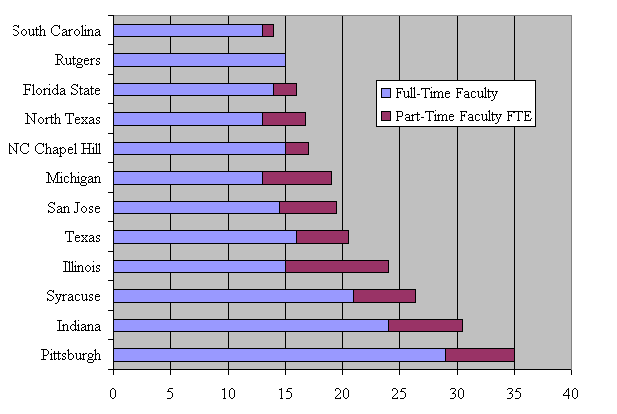
Figure 4. Twelve Largest Faculties
Source: Tables I-41, I-43
It may be noted that only three of the schools with the largest faculties—Indiana, Texas, and San Jose—also appear in Figure 2 as having the largest LIS student bodies.
As Figure 5 conveys, total student-body size predicts only five members of the top 10. Nonetheless, it evokes an important story now muffled in the Report. Because students are tallied only in the programs in which they are enrolled, one must combine the raw counts across tables to learn how big any ALISE school is overall (cf. Woodsworth, 1994, 3). The totals in Figure 5 exclude students in undergraduate and graduate service courses offered for other colleges and departments, but include all students enrolled "in-house." By this measure, two similarly diversified schools have the largest student bodies in ALISE—Drexel with 917 and Syracuse with 876. Florida State, the lowest-ranked shown, has 417. Other "400-plus" student bodies are Texas with 405 and Long Island with 403. Some schools run very large service programs for undergraduate students on their campuses—for example, Texas (662), South Florida (380) and Indiana (329).
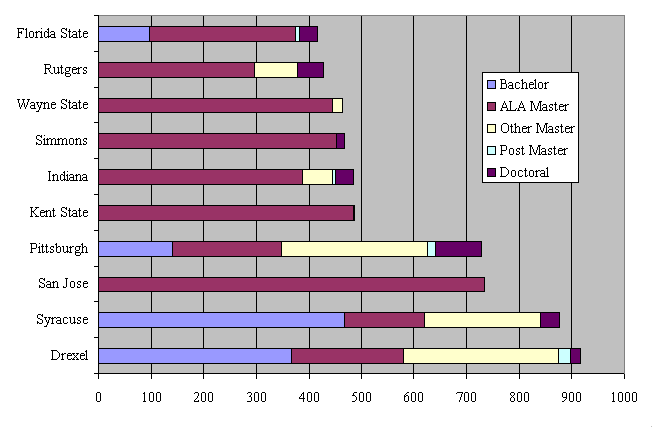
Figure 5. Ten Largest Student Body Sizes
Source: Tables from Section II
The bargraph profiles of the 10 schools in Figure 5 suggest that two main economic strategies are being pursued. San Jose, Kent State, Simmons, and Wayne State are essentially big library schools; they attract the largest graduate enrollments in LIS in America. The remaining six schools have expanded into more differentiated markets. Drexel, Syracuse, Pittsburgh, and Florida State have sizable undergraduate programs in information systems and services. (The definition of such programs should be broadened from the present "bachelor’s degree in library and information science" to fit the current reality; Drexel’s program now misreports its undergraduates in "Other Undergraduate," which is for service-course enrollments) Drexel, Syracuse, Pittsburgh, Indiana, and Rutgers all offer master’s degrees in nonlibrary-based information professions as well.
It is the latter five schools that appear in the U.S. News & World Report top 10. This is not to imply any lessening commitment to librarianship on their part; all maintain ALA-accredited programs with enrollments ranging from 153 (Syracuse) to 387 (Rutgers). It is merely to note their diversification, which many would argue has strengthened their L&IS programs and made them less vulnerable to academic predators. In any case, the expansion strategy seems not to have hurt their showing in the survey by U.S. News & World Report.
Seven of the schools in Figure 5 have doctoral programs, Pitt’s being the largest at 87. The presence or absence of a doctoral program is a differentiator already used in this Report, in the chapter on Income and Expenditures. Having one indeed seems critical if a school is to be highly esteemed; all schools in the U.S. News & World Report top 10 offer doctoral programs. When I began this chapter, I thought I would select variables from this year’s data, such as those in the figures above, to try to find the best predictors of membership in the top 10 through discriminant analysis. (This is a statistical technique for predicting membership in pre-assigned categories on the basis of scores on ratio-scale variables; it is computerized in such packages as SPSS and SAS) Since only American schools with doctoral programs appeared in the top 10—my first category—I chose the remaining American schools with doctoral programs from the ALISE list and made them my second category for comparison. No matter what variables I used (entering them simultaneously), the best predictor was always school income, as in Figure 3. The schools not in the top 10 were always correctly predicted, but the schools in the top 10 were not. The most accurate prediction I obtained was 8 out of 10, because the computer misclassified two schools that are relatively low on the income variable this year, Rutgers and Wisconsin Madison.
I tried augmenting the ALISE data with data from Budd & Seavey (1996) on faculty publications and citations received (cf. Hannigan, 1990, 271). However, this move, though well justified theoretically, did not improve prediction. Schools that scored very high on Budd & Seavey’s measures, such as UCLA, were put in the top 10 by the computer, in disagreement with the human raters for U.S. News & World Report (who at the time may have been upset by the UCLA and UC Berkeley reorganizations). It would appear that Figure 3’s straightforward ranking, which gets 9 out of 10 right, cannot readily be improved upon. Money—especially grant and contract money—is the great simplifier.
The discriminant exercise was only semi-serious (the chronology is off; I am using data from the year after the survey rather than from some time before, when impressions would have been formed). However, I am convinced that some of the variables in the Report would repay serious multivariate analyses of the sort published in Mulvaney (1992; see also his citations). Even if that is not done, they should be organized to bear on the question of what we mean when we say that a school is distinguished. From that, all else flows.
Health in LIS Education
My final task is an easy one. It is simply to remind readers, once again, that the Report lacks graphical displays of trends, and that, until they are provided, no one can quickly assess what is going on in LIS education. Were some of the editorial time now spent on single-year tables reallocated to multi-year charts, the Report would in a flash become much more informative. The top priority for the Millennium edition should be the assembling and charting of time series from back annual issues. (Excellent software for displaying trends is now available)
In this year’s issue, the chapter of Faculty by Timothy Sineath and the chapter on Income and Expenditure by Fred Roper and John Olsgaard contain such time series. The variables these authors monitor point the way—for example, from Sineath, average faculty size, male-female ratio of full-time faculty, ratio of new faculty appointments to total faculty, and average salaries at various academic ranks; from Roper and Olsgaard, total and average income of reporting schools and average funding from parent institutions, the federal government, and other sources.
On some variables (e.g., sex, ethnicity, and age of students), school by school comparisons within programs within a single year hardly make sense; the data are too fragmented. The only revealing comparisons are for ALISE schools in the aggregate over time, so that the presence or absence of large-scale shifts becomes detectable. Only if a school departs markedly from norms for the field—a library science program with males in the majority, for example—does it become interesting in its own right.
On other variables (e.g., tuition, student-body size, faculty size), the ability to compare individual schools each year is indeed of interest. Even so, aggregate figures for all ALISE schools across the years should also be charted. The small blips up or down reported annually are not as important as long-term trends in totals and averages. We would probably regard as "healthy" long-term growth in, for example:
- Total income
- Share of income from sources other than the parent institution, such as governments and foundations
- Total student enrollments in ALISE schools and their various degree programs
- Number of graduates from ALISE schools and their various degree programs
- Total faculty in ALISE schools, but especially full-time faculty relative to part-time
- Scholarship and fellowship aid within degree programs
- Number of distance education and continuing education programs
- Ethnic diversity of students
These are indicators that would genuinely mean something. Attendees of ALISE conferences could doubtless supply more. It is even possible to imagine a day when people might say, "I hear the new ALISE Statistical Report is out. Let’s go sneak into the Dean’s office and take a look at it!"
References
A Brand-new World. The digital age is transforming the education of librarians. (1996) Best Graduate Schools. U.S. News & World Report. 54–55.
Budd, John M., and Charles A. Seavey. (1996). Productivity of U.S. Library and Information Science Faculty: The Hayes Study Revisited. Library Quarterly 66: 1–20.
Daniel, Evelyn H. (1997). Summary and Comparative Analysis. In Evelyn H. Daniel and Jerry D. Saye, eds. Library and Information Science Education Statistical Report 1997. Arlington, VA: Association for Library and Information Science Education. 345-354.
Hannigan, Jane A. (1990). Summary and Comparative Analysis. In Timothy W. Sineath, ed. Library and Information Science Education Statistical Report 1990. Sarasota, FL: Association for Library and Information Science Education. 271–278.
Estabrook, Leigh S. (1993). Summary and Comparative Analysis. In Timothy W. Sineath, ed. Library and Information Science Education Statistical Report 1993. Raleigh, NC: Association for Library and Information Science Education. 323–330.
Mulvaney, John Philip. (1992) The Characteristics Associated with Perceived Quality in Schools of Library and Information Science. Library Quarterly 62: 1–27.
Sineath, Timothy W. (1991). Summary and Comparative Analysis. In Timothy W. Sineath, ed. Library and Information Science Education Statistical Report 1991. Sarasota, FL: Association for Library and Information Science Education. 306–319.
U.S. Department of Health, Education, and Welfare. (1969). Toward a Social Report. Washington, D.C.: Government Printing Office.
White, Howard D. (1992). External Memory. In Howard D. White, Marcia J. Bates, and Patrick Wilson. For Information Specialists: Interpretations of Reference and Bibliographic Work. Norwood, NJ: Ablex. 249–294.
Woodsworth, Anne. (1994). In Timothy W. Sineath, ed. Library and Information Science Education Statistical Report 1994. Raleigh, NC: Association for Library and Information Science Education. 1–7.