|
1
|
- Interface 2003
- March 14, 2003
- Salt Lake City
- Gary Marchionini
- University of North Carolina at Chapel Hill
- march@ils.unc.edu
|
|
2
|
- NSF Digital Government Program
- Cooperative research grant 2002-2005
- UNC-CH EIA 0131824
- UMD-CP EIA 0129978
- BLS, EIA, NASS, SSA, Census, NCHS
- User interfaces as the glue in a SKN
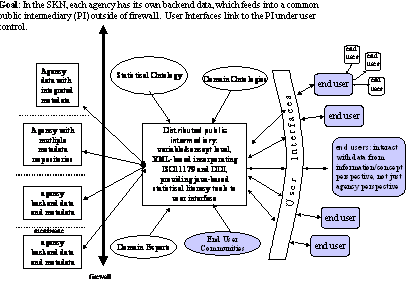
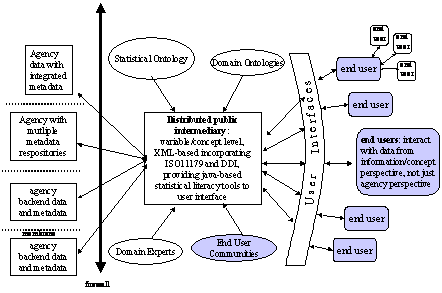
- Audience: Novice/casual end users
- See http://www.ils.unc.edu/govstat
|
|
3
|
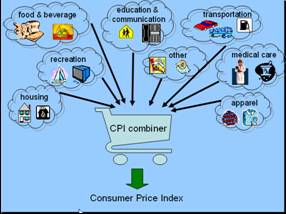
- Information resources
- Tools for collecting, finding, using, and managing statistical
information
- People and processes that gather, analyze, manage, and report
statistical information
- Concept-based rather than file-based.
|
|
4
|
|
|
5
|
|
|
6
|
- Massive volumes of federal, state, and local statistical
information=> need for good filtering support.
- Federal, state, and local statistical providers use a variety of
standards, formats, terminology, and practices for collecting and
disseminating statistics=> need for metadata interoperation.
- The full population includes people with diverse user needs,
experiences, and technological platforms=> need for multiple,
alternative solutions.
- The level of statistical/numerical literacy in the population is
generally low=> need for online help and support.
|
|
7
|
- User Needs: Scenarios
- Metadata
- Information architecture
- Manual (both agency and user centered)
- Automatic
- Vocabulary & Concepts
- Help
|
|
8
|
|
|
9
|
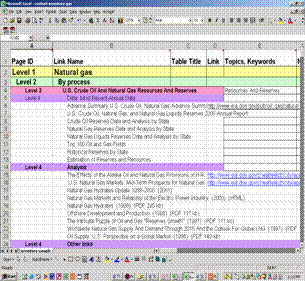
- Automatic classification
- Crawl website(s)
- Create reduced term-document matrix
- Cluster (various)
- Label clusters
- Apply labels and documents to different views (slices/dices)
- Evaluate
|
|
10
|
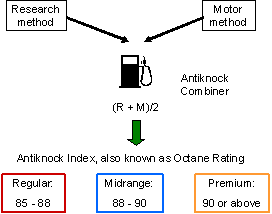
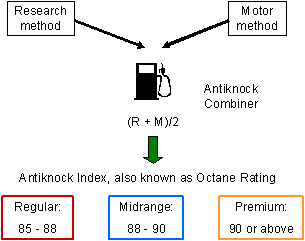
- Statistical Ontology (see also Hovy)
- Concepts mapped to metadata
- Interactive Statistical Glossary
- Simple and extended textual definitions
- Graphical explanations
- Animated explanations
- Links to experts and community
- Context dependent, core set of terms, hover or click mechanisms, video
or Flash explanations for specific numbers (in text or in tables)
|
|
11
|
|
|
12
|
|
|
13
|
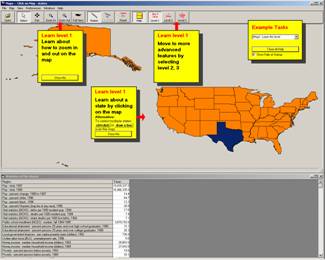
- Multilayered Interfaces
- Integrated Initial Guidance
- Animated and Video Demos
|
|
14
|
|
|
15
|
- Create script (much easier for specific activities than for concepts)
- Record vignette (5-15 seconds)
- Add effects and voice over
- Package and link
|
|
16
|
- FAQ
- Glossary (where applicable)
- Email experts at agencies
- Post to community
- Chat with shared browser
|
|
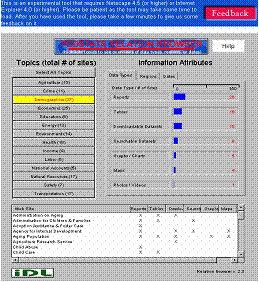
17
|
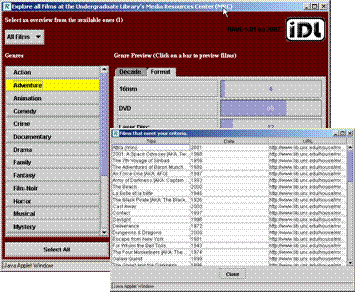
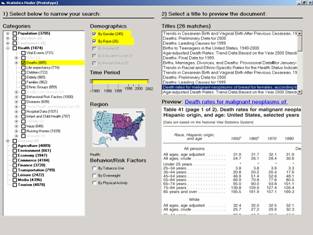
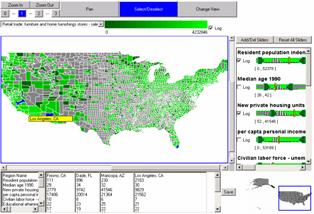
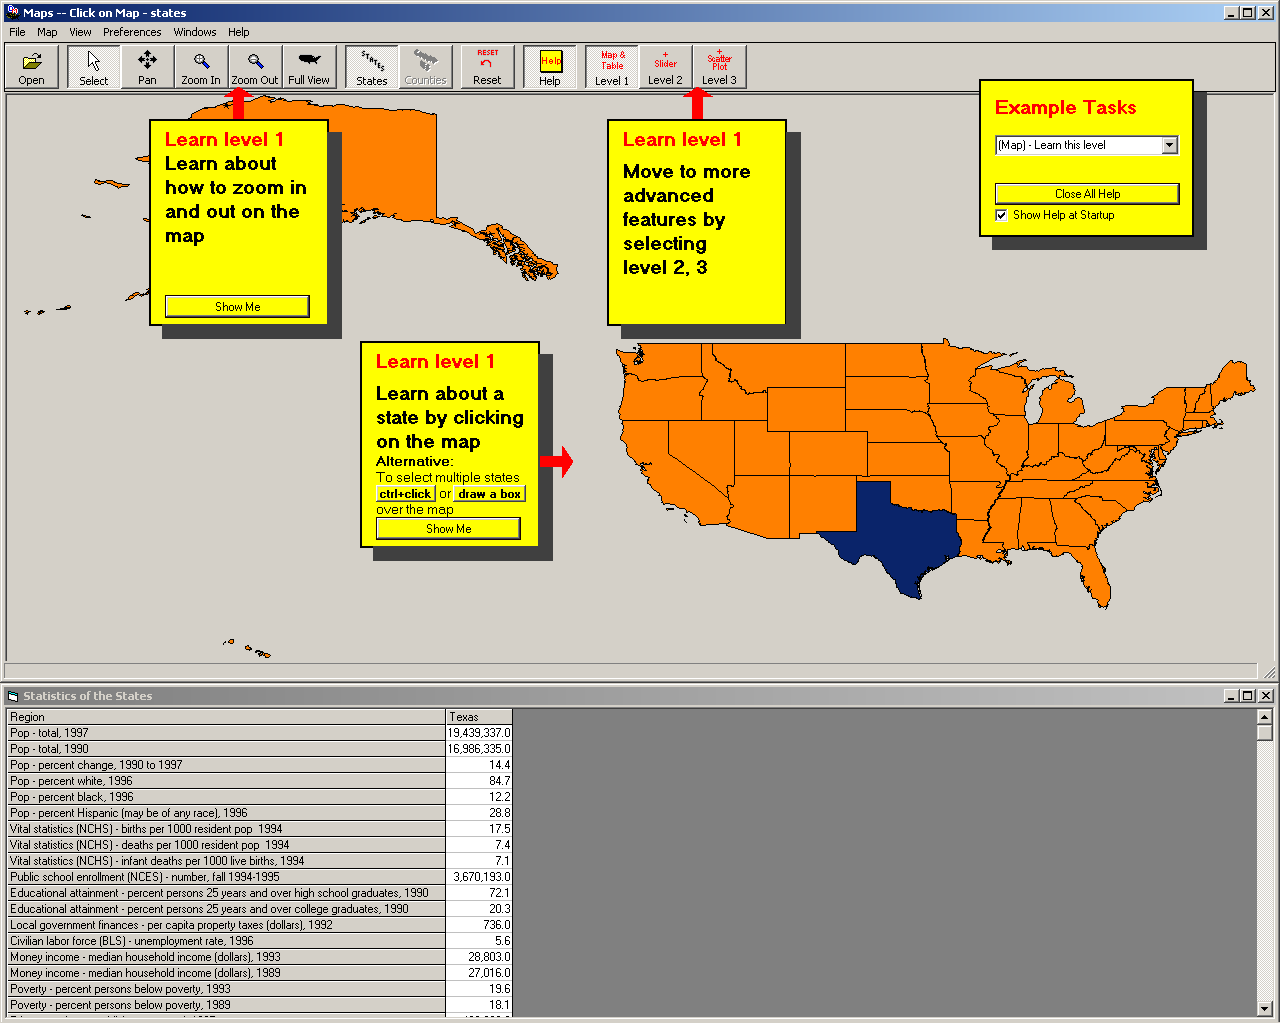
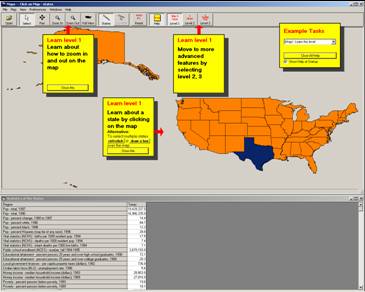
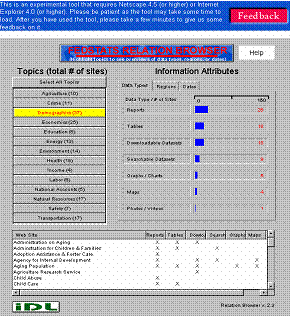
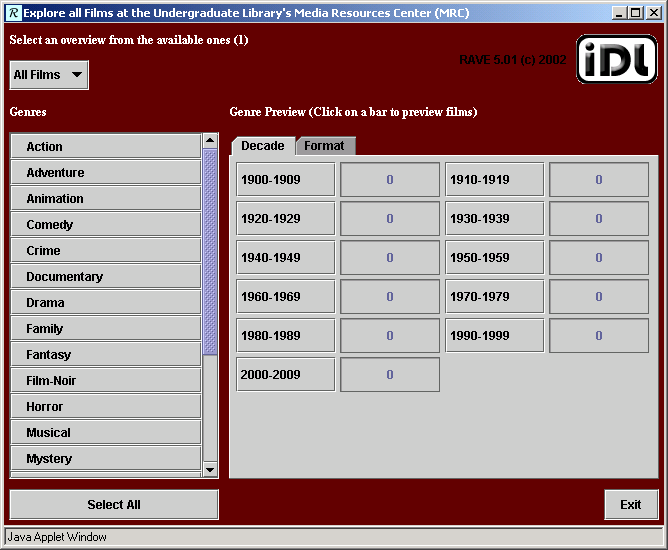
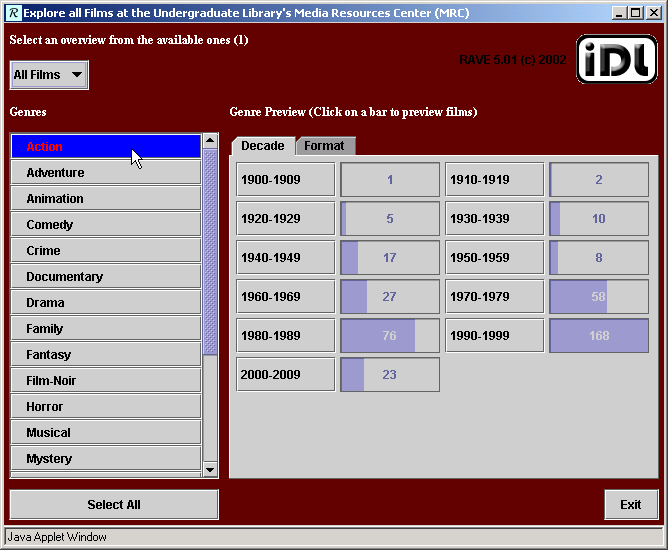
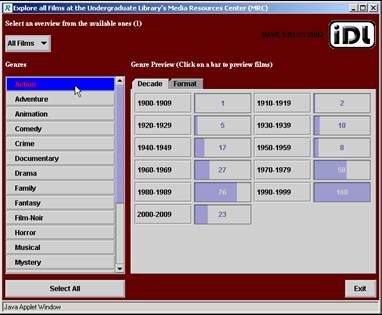
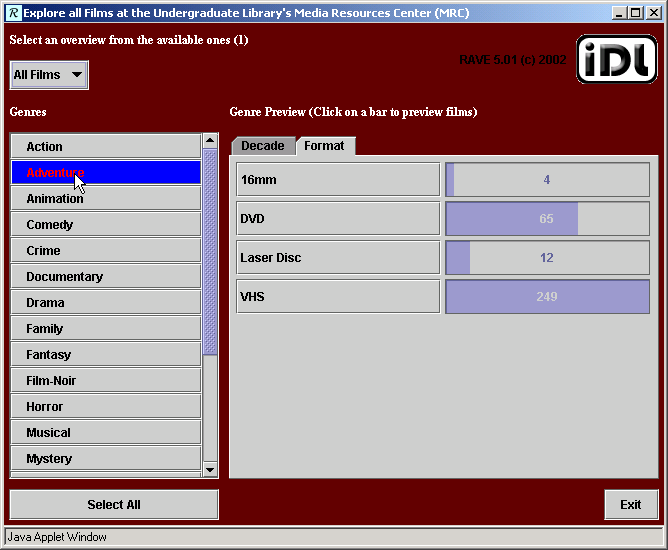
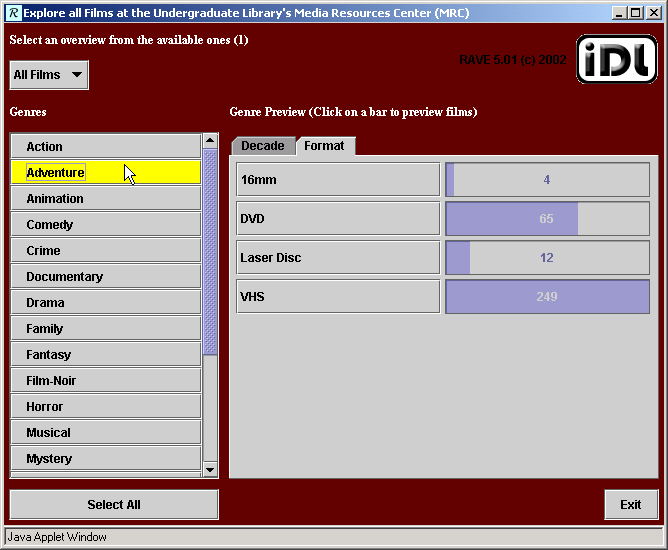
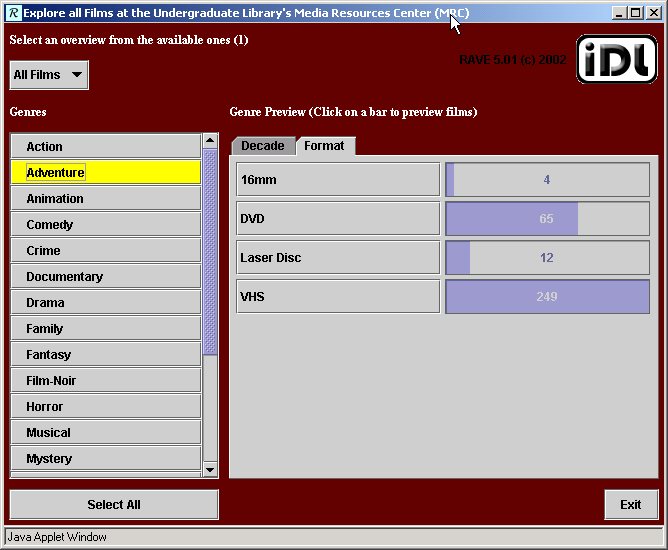
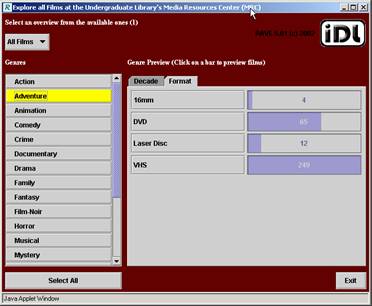
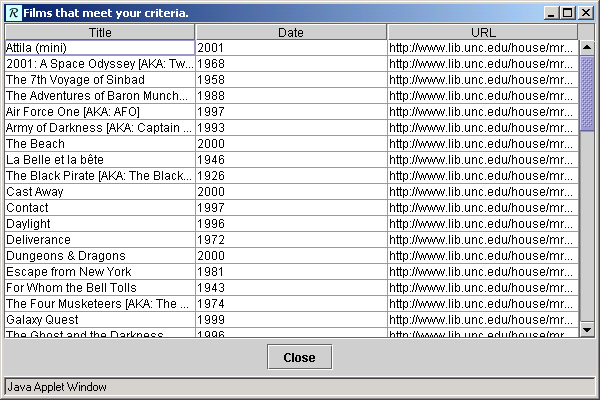
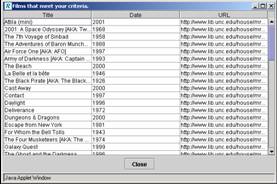
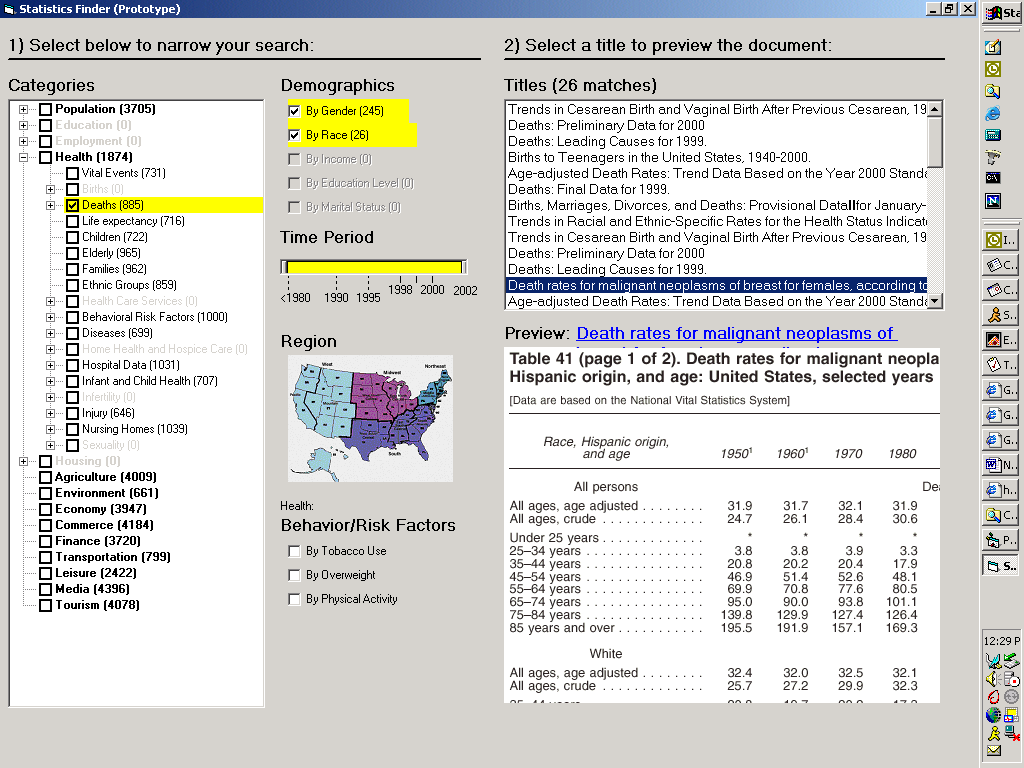
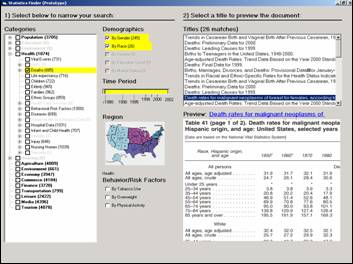
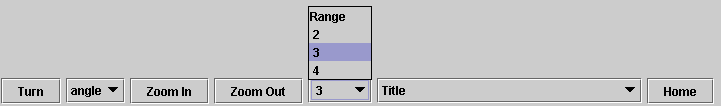
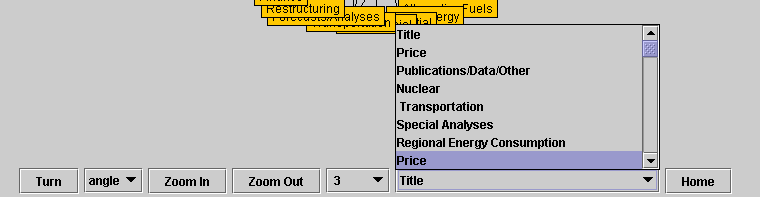
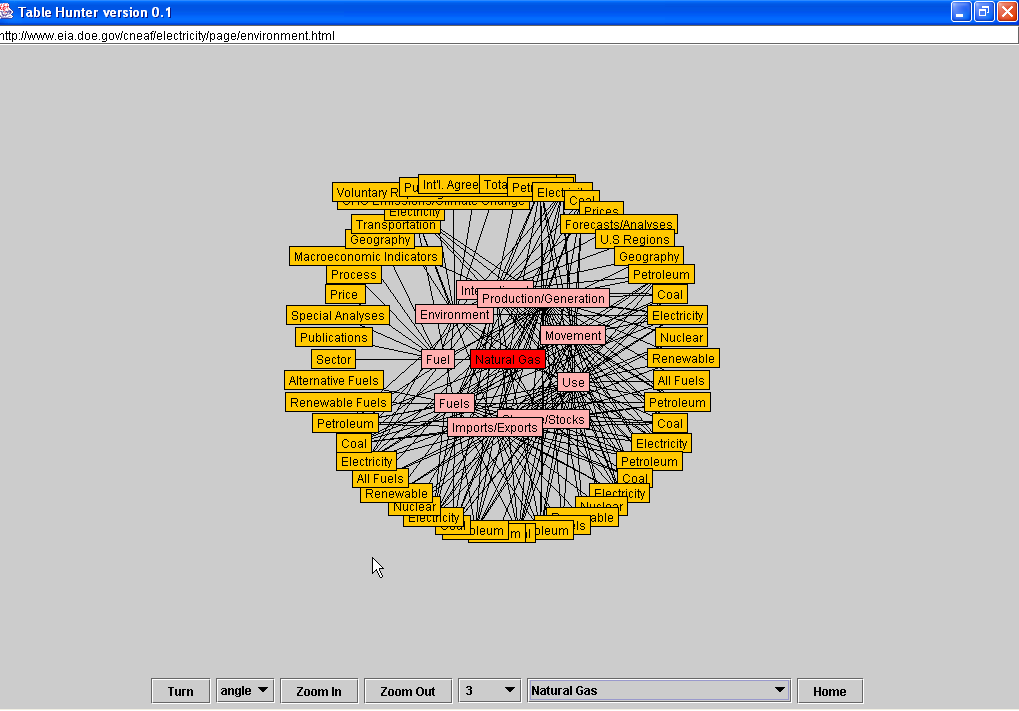
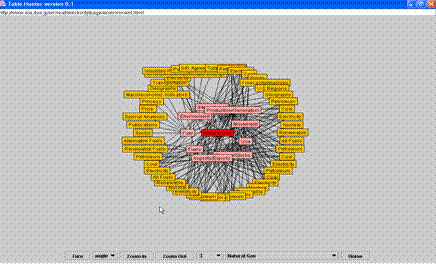
- Relation Browsers (Simple and Advanced)
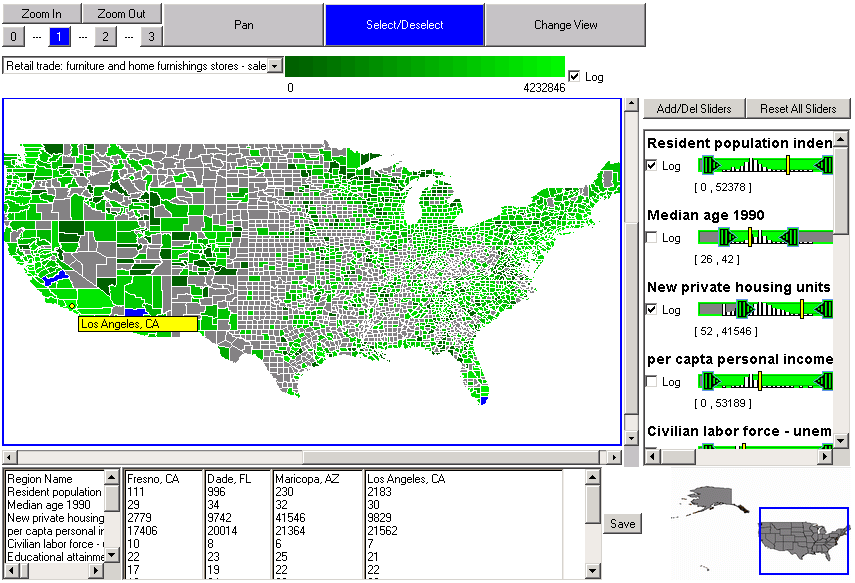
- Interactive Maps (Spatial Browsers)
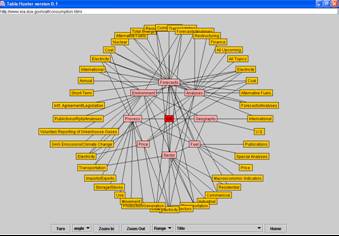
- Free Link Browsers (Network Browsers)
|
|
18
|
|
|
19
|
- Several usability studies
- Multiple database upgrades
- Separate results and exploration to preserve screen real estate
- Implementations for several kinds of data
|
|
20
|
|
|
21
|
|
|
22
|
|
|
23
|
|
|
24
|
|
|
25
|
|
|
26
|
|
|
27
|
|
|
28
|
|
|
29
|
|
|
30
|
|
|
31
|
|
|
32
|
|
|
33
|
|
|
34
|
- Refine and test prototypes
- Relation Browser & Visual Interface
- Statistical Glossary & Domain Ontologies
- Multi-layer designs
- Continue multi-faceted attack on categorization (slicing)
- Integration progress
- Metadata hunt continues
- Promote universal usability
- Develop common metric of success
- Incorporate more state and local resources
|

 Notes
Notes